Zip Codes with the Highest Percentage of Population Employed in Cleaning & Maintenance in Gretna, LA
RELATED REPORTS & OPTIONS
Cleaning & Maintenance
Gretna
Compare Zip Codes
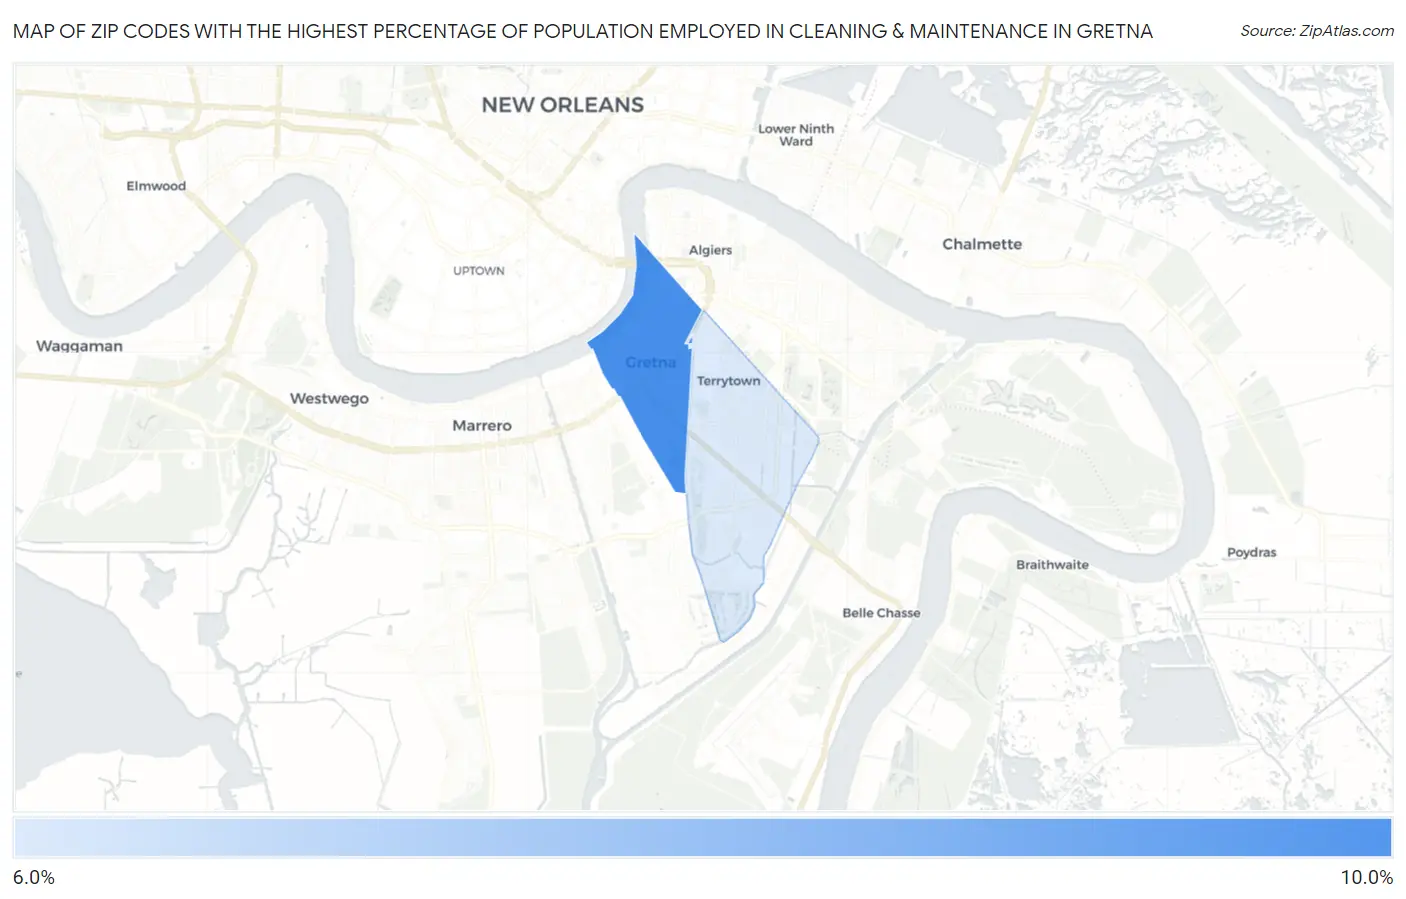
Map of Zip Codes with the Highest Percentage of Population Employed in Cleaning & Maintenance in Gretna
0.0%
10.0%
Zip Codes with the Highest Percentage of Population Employed in Cleaning & Maintenance in Gretna, LA
| Zip Code | % Employed | vs State | vs National | |
| 1. | 70053 | 8.3% | 3.7%(+4.53)#60 | 3.5%(+4.78)#2,812 |
| 2. | 70056 | 6.1% | 3.7%(+2.42)#113 | 3.5%(+2.66)#5,376 |
1
Common Questions
What are the Top Zip Codes with the Highest Percentage of Population Employed in Cleaning & Maintenance in Gretna, LA?
Top Zip Codes with the Highest Percentage of Population Employed in Cleaning & Maintenance in Gretna, LA are:
What zip code has the Highest Percentage of Population Employed in Cleaning & Maintenance in Gretna, LA?
70053 has the Highest Percentage of Population Employed in Cleaning & Maintenance in Gretna, LA with 8.3%.
What is the Percentage of Population Employed in Cleaning & Maintenance in Gretna, LA?
Percentage of Population Employed in Cleaning & Maintenance in Gretna is 7.7%.
What is the Percentage of Population Employed in Cleaning & Maintenance in Louisiana?
Percentage of Population Employed in Cleaning & Maintenance in Louisiana is 3.7%.
What is the Percentage of Population Employed in Cleaning & Maintenance in the United States?
Percentage of Population Employed in Cleaning & Maintenance in the United States is 3.5%.