Yuman vs Iroquois Householder Income Ages 25 - 44 years
COMPARE
Yuman
Iroquois
Householder Income Ages 25 - 44 years
Householder Income Ages 25 - 44 years Comparison
Yuman
Iroquois
$72,956
HOUSEHOLDER INCOME AGES 25 - 44 YEARS
0.0/ 100
METRIC RATING
339th/ 347
METRIC RANK
$83,682
HOUSEHOLDER INCOME AGES 25 - 44 YEARS
0.2/ 100
METRIC RATING
273rd/ 347
METRIC RANK
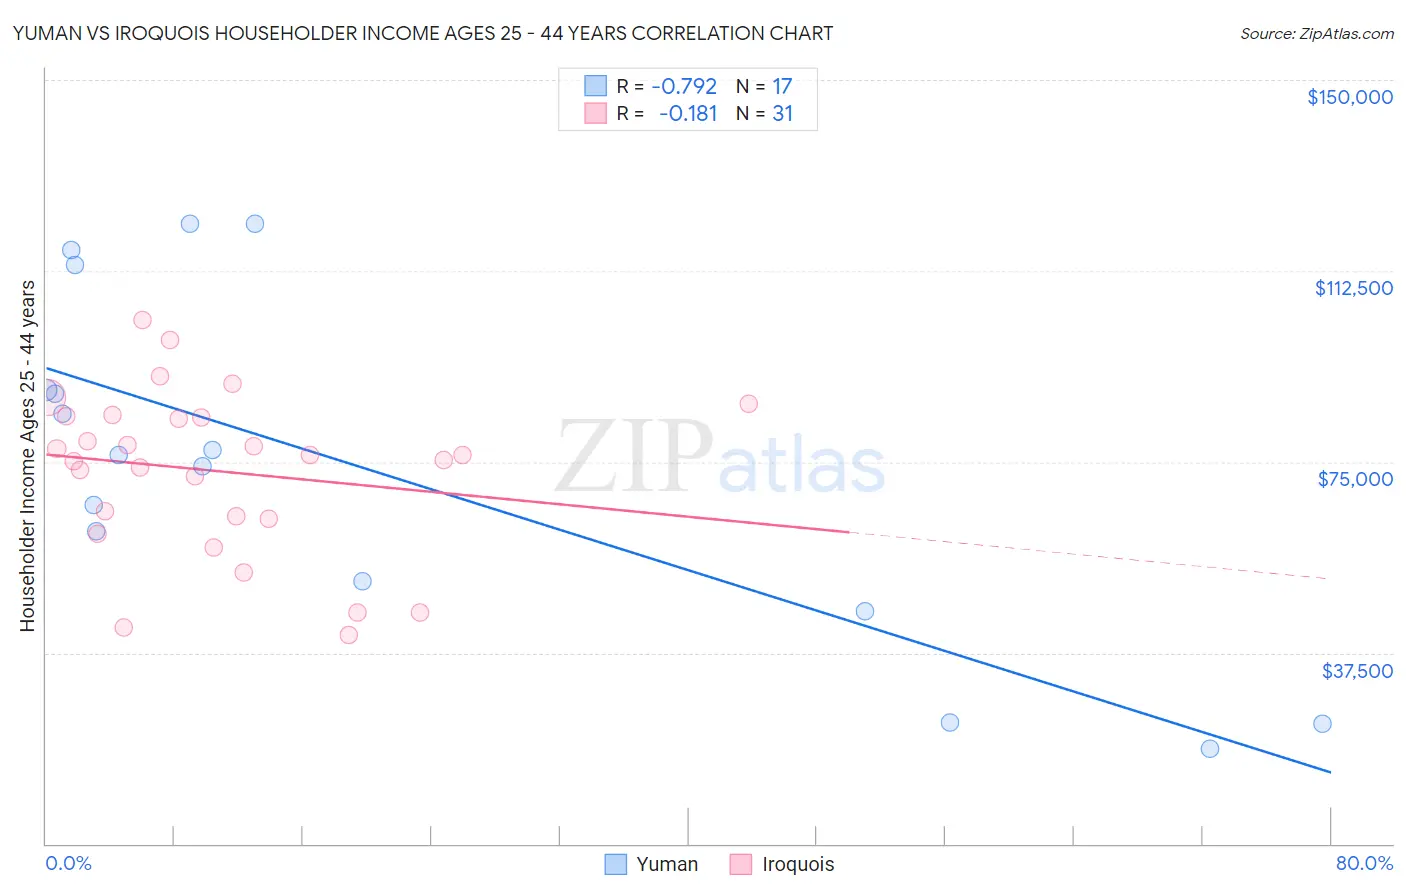
Yuman vs Iroquois Householder Income Ages 25 - 44 years Correlation Chart
The statistical analysis conducted on geographies consisting of 40,597,364 people shows a strong negative correlation between the proportion of Yuman and household income with householder between the ages 25 and 44 in the United States with a correlation coefficient (R) of -0.792 and weighted average of $72,956. Similarly, the statistical analysis conducted on geographies consisting of 207,014,213 people shows a poor negative correlation between the proportion of Iroquois and household income with householder between the ages 25 and 44 in the United States with a correlation coefficient (R) of -0.181 and weighted average of $83,682, a difference of 14.7%.
Householder Income Ages 25 - 44 years Correlation Summary
| Measurement | Yuman | Iroquois |
| Minimum | $18,542 | $40,878 |
| Maximum | $121,667 | $102,951 |
| Range | $103,125 | $62,073 |
| Mean | $73,782 | $73,208 |
| Median | $76,250 | $76,438 |
| Interquartile 25% (IQ1) | $48,591 | $63,949 |
| Interquartile 75% (IQ3) | $101,410 | $84,029 |
| Interquartile Range (IQR) | $52,819 | $20,079 |
| Standard Deviation (Sample) | $33,681 | $16,006 |
| Standard Deviation (Population) | $32,676 | $15,746 |
Similar Demographics by Householder Income Ages 25 - 44 years
Demographics Similar to Yuman by Householder Income Ages 25 - 44 years
In terms of householder income ages 25 - 44 years, the demographic groups most similar to Yuman are Immigrants from Yemen ($73,043, a difference of 0.12%), Black/African American ($73,370, a difference of 0.57%), Yup'ik ($73,688, a difference of 1.0%), Immigrants from Congo ($72,178, a difference of 1.1%), and Arapaho ($71,697, a difference of 1.8%).
| Demographics | Rating | Rank | Householder Income Ages 25 - 44 years |
| Bahamians | 0.0 /100 | #332 | Tragic $75,395 |
| Hopi | 0.0 /100 | #333 | Tragic $75,002 |
| Creek | 0.0 /100 | #334 | Tragic $74,847 |
| Kiowa | 0.0 /100 | #335 | Tragic $74,776 |
| Yup'ik | 0.0 /100 | #336 | Tragic $73,688 |
| Blacks/African Americans | 0.0 /100 | #337 | Tragic $73,370 |
| Immigrants | Yemen | 0.0 /100 | #338 | Tragic $73,043 |
| Yuman | 0.0 /100 | #339 | Tragic $72,956 |
| Immigrants | Congo | 0.0 /100 | #340 | Tragic $72,178 |
| Arapaho | 0.0 /100 | #341 | Tragic $71,697 |
| Crow | 0.0 /100 | #342 | Tragic $71,337 |
| Tohono O'odham | 0.0 /100 | #343 | Tragic $69,068 |
| Pueblo | 0.0 /100 | #344 | Tragic $68,910 |
| Navajo | 0.0 /100 | #345 | Tragic $66,529 |
| Puerto Ricans | 0.0 /100 | #346 | Tragic $65,996 |
Demographics Similar to Iroquois by Householder Income Ages 25 - 44 years
In terms of householder income ages 25 - 44 years, the demographic groups most similar to Iroquois are Spanish American ($83,722, a difference of 0.050%), Somali ($83,752, a difference of 0.080%), Marshallese ($83,575, a difference of 0.13%), Jamaican ($83,933, a difference of 0.30%), and Immigrants from Jamaica ($83,298, a difference of 0.46%).
| Demographics | Rating | Rank | Householder Income Ages 25 - 44 years |
| Immigrants | Cabo Verde | 0.3 /100 | #266 | Tragic $84,304 |
| Hmong | 0.3 /100 | #267 | Tragic $84,258 |
| Sub-Saharan Africans | 0.3 /100 | #268 | Tragic $84,235 |
| Spanish American Indians | 0.3 /100 | #269 | Tragic $84,085 |
| Jamaicans | 0.3 /100 | #270 | Tragic $83,933 |
| Somalis | 0.2 /100 | #271 | Tragic $83,752 |
| Spanish Americans | 0.2 /100 | #272 | Tragic $83,722 |
| Iroquois | 0.2 /100 | #273 | Tragic $83,682 |
| Marshallese | 0.2 /100 | #274 | Tragic $83,575 |
| Immigrants | Jamaica | 0.2 /100 | #275 | Tragic $83,298 |
| Immigrants | Belize | 0.2 /100 | #276 | Tragic $83,141 |
| Paiute | 0.2 /100 | #277 | Tragic $82,984 |
| Senegalese | 0.2 /100 | #278 | Tragic $82,852 |
| Pima | 0.1 /100 | #279 | Tragic $82,821 |
| Colville | 0.1 /100 | #280 | Tragic $82,604 |