Yaqui vs Immigrants from Oceania Householder Income Ages 45 - 64 years

COMPARE

Yaqui
Race
Ancestry
AfghanAfricanAlaska NativeAlaskan AthabascanAlbanianAleutAlsatianAmericanApacheArabArapahoArgentineanArmenianAssyrian/Chaldean/SyriacAustralianAustrianBahamianBangladeshiBarbadianBasqueBelgianBelizeanBermudanBhutaneseBlackfeetBolivianBrazilianBritishBritish West IndianBulgarianBurmeseCajunCambodianCanadianCape VerdeanCarpatho RusynCelticCentral AmericanCentral American IndianCherokeeCheyenneChickasawChileanChineseChippewaChoctawColombianColvilleComancheCosta RicanCreeCreekCroatianCrowCubanCypriotCzechCzechoslovakianDanishDelawareDominicanDutchDutch West IndianEastern EuropeanEcuadorianEgyptianEnglishEstonianEthiopianEuropeanFijianFilipinoFinnishFrenchFrench American IndianFrench CanadianGermanGerman RussianGhanaianGreekGuamanian/ChamorroGuatemalanGuyaneseHaitianHmongHonduranHopiHoumaHungarianIcelanderIndian (Asian)IndonesianInupiatIranianIraqiIrishIroquoisIsraeliItalianJamaicanJapaneseJordanianKenyanKiowaKoreanLaotianLatvianLebaneseLiberianLithuanianLumbeeLuxembourgerMacedonianMalaysianMalteseMarshalleseMenomineeMexicanMexican American IndianMongolianMoroccanNative HawaiianNavajoNepaleseNew ZealanderNicaraguanNigerianNorthern EuropeanNorwegianOkinawanOsageOttawaPaiutePakistaniPalestinianPanamanianParaguayanPennsylvania GermanPeruvianPimaPolishPortuguesePotawatomiPuebloPuerto RicanPuget Sound SalishRomanianRussianSalvadoranSamoanScandinavianScotch-IrishScottishSeminoleSenegaleseSerbianShoshoneSierra LeoneanSiouxSlavicSlovakSloveneSomaliSouth AfricanSouth AmericanSouth American IndianSoviet UnionSpaniardSpanishSpanish AmericanSpanish American IndianSri LankanSubsaharan AfricanSudaneseSwedishSwissSyrianTaiwaneseThaiTlingit-HaidaTohono O'OdhamTonganTrinidadian and TobagonianTsimshianTurkishU.S. Virgin IslanderUgandanUkrainianUruguayanUteVenezuelanVietnameseWelshWest IndianYakamaYaquiYugoslavianYumanYup'ikZimbabwean
Immigration
NonimmigrantsImmigrantsAfghanistanAfricaAlbaniaArgentinaArmeniaAsiaAustraliaAustriaBahamasBangladeshBarbadosBelarusBelgiumBelizeBoliviaBosnia and HerzegovinaBrazilBulgariaBurma/MyanmarCabo VerdeCambodiaCameroonCanadaCaribbeanCentral AmericaChileChinaColombiaCongoCosta RicaCroatiaCubaCzechoslovakiaDenmarkDominicaDominican RepublicEastern AfricaEastern AsiaEastern EuropeEcuadorEgyptEl SalvadorEnglandEritreaEthiopiaEuropeFijiFranceGermanyGhanaGreeceGrenadaGuatemalaGuyanaHaitiHondurasHong KongHungaryIndiaIndonesiaIranIraqIrelandIsraelItalyJamaicaJapanJordanKazakhstanKenyaKoreaKuwaitLaosLatin AmericaLatviaLebanonLiberiaLithuaniaMalaysiaMexicoMicronesiaMiddle AfricaMoldovaMoroccoNepalNetherlandsNicaraguaNigeriaNorth AmericaNorth MacedoniaNorthern AfricaNorthern EuropeNorwayPakistanPanamaPeruPhilippinesPolandPortugalRomaniaRussiaSaudi ArabiaScotlandSenegalSerbiaSierra LeoneSingaporeSomaliaSouth AfricaSouth AmericaSouth Central AsiaSouth Eastern AsiaSouthern EuropeSpainSri LankaSt. Vincent and the GrenadinesSudanSwedenSwitzerlandSyriaTaiwanThailandTrinidad and TobagoTurkeyUgandaUkraineUruguayUzbekistanVenezuelaVietnamWest IndiesWestern AfricaWestern AsiaWestern EuropeYemenZaireZimbabweAzores
Immigrants from Oceania
Race
Ancestry
AfghanAfricanAlaska NativeAlaskan AthabascanAlbanianAleutAlsatianAmericanApacheArabArapahoArgentineanArmenianAssyrian/Chaldean/SyriacAustralianAustrianBahamianBangladeshiBarbadianBasqueBelgianBelizeanBermudanBhutaneseBlackfeetBolivianBrazilianBritishBritish West IndianBulgarianBurmeseCajunCambodianCanadianCape VerdeanCarpatho RusynCelticCentral AmericanCentral American IndianCherokeeCheyenneChickasawChileanChineseChippewaChoctawColombianColvilleComancheCosta RicanCreeCreekCroatianCrowCubanCypriotCzechCzechoslovakianDanishDelawareDominicanDutchDutch West IndianEastern EuropeanEcuadorianEgyptianEnglishEstonianEthiopianEuropeanFijianFilipinoFinnishFrenchFrench American IndianFrench CanadianGermanGerman RussianGhanaianGreekGuamanian/ChamorroGuatemalanGuyaneseHaitianHmongHonduranHopiHoumaHungarianIcelanderIndian (Asian)IndonesianInupiatIranianIraqiIrishIroquoisIsraeliItalianJamaicanJapaneseJordanianKenyanKiowaKoreanLaotianLatvianLebaneseLiberianLithuanianLumbeeLuxembourgerMacedonianMalaysianMalteseMarshalleseMenomineeMexicanMexican American IndianMongolianMoroccanNative HawaiianNavajoNepaleseNew ZealanderNicaraguanNigerianNorthern EuropeanNorwegianOkinawanOsageOttawaPaiutePakistaniPalestinianPanamanianParaguayanPennsylvania GermanPeruvianPimaPolishPortuguesePotawatomiPuebloPuerto RicanPuget Sound SalishRomanianRussianSalvadoranSamoanScandinavianScotch-IrishScottishSeminoleSenegaleseSerbianShoshoneSierra LeoneanSiouxSlavicSlovakSloveneSomaliSouth AfricanSouth AmericanSouth American IndianSoviet UnionSpaniardSpanishSpanish AmericanSpanish American IndianSri LankanSubsaharan AfricanSudaneseSwedishSwissSyrianTaiwaneseThaiTlingit-HaidaTohono O'OdhamTonganTrinidadian and TobagonianTsimshianTurkishU.S. Virgin IslanderUgandanUkrainianUruguayanUteVenezuelanVietnameseWelshWest IndianYakamaYugoslavianYumanYup'ikZimbabwean
Immigration
NonimmigrantsImmigrantsAfghanistanAfricaAlbaniaArgentinaArmeniaAsiaAustraliaAustriaBahamasBangladeshBarbadosBelarusBelgiumBelizeBoliviaBosnia and HerzegovinaBrazilBulgariaBurma/MyanmarCabo VerdeCambodiaCameroonCanadaCaribbeanCentral AmericaChileChinaColombiaCongoCosta RicaCroatiaCubaCzechoslovakiaDenmarkDominicaDominican RepublicEastern AfricaEastern AsiaEastern EuropeEcuadorEgyptEl SalvadorEnglandEritreaEthiopiaEuropeFijiFranceGermanyGhanaGreeceGrenadaGuatemalaGuyanaHaitiHondurasHong KongHungaryIndiaIndonesiaIranIraqIrelandIsraelItalyJamaicaJapanJordanKazakhstanKenyaKoreaKuwaitLaosLatin AmericaLatviaLebanonLiberiaLithuaniaMalaysiaMexicoMicronesiaMiddle AfricaMoldovaMoroccoNepalNetherlandsNicaraguaNigeriaNorth AmericaNorth MacedoniaNorthern AfricaNorthern EuropeNorwayOceaniaPakistanPanamaPeruPhilippinesPolandPortugalRomaniaRussiaSaudi ArabiaScotlandSenegalSerbiaSierra LeoneSingaporeSomaliaSouth AfricaSouth AmericaSouth Central AsiaSouth Eastern AsiaSouthern EuropeSpainSri LankaSt. Vincent and the GrenadinesSudanSwedenSwitzerlandSyriaTaiwanThailandTrinidad and TobagoTurkeyUgandaUkraineUruguayUzbekistanVenezuelaVietnamWest IndiesWestern AfricaWestern AsiaWestern EuropeYemenZaireZimbabweAzores
Householder Income Ages 45 - 64 years
Income
Poverty
Unemployment
Labor Participation
Family Structure
Vehicle Availability
Education Level
Disability

Householder Income Ages 45 - 64 years Comparison

Yaqui

Immigrants from Oceania

Tragic
Excellent
$86,914
HOUSEHOLDER INCOME AGES 45 - 64 YEARS
0.1/ 100
METRIC RATING
281st/ 347
METRIC RANK
$103,705
HOUSEHOLDER INCOME AGES 45 - 64 YEARS
84.5/ 100
METRIC RATING
139th/ 347
METRIC RANK

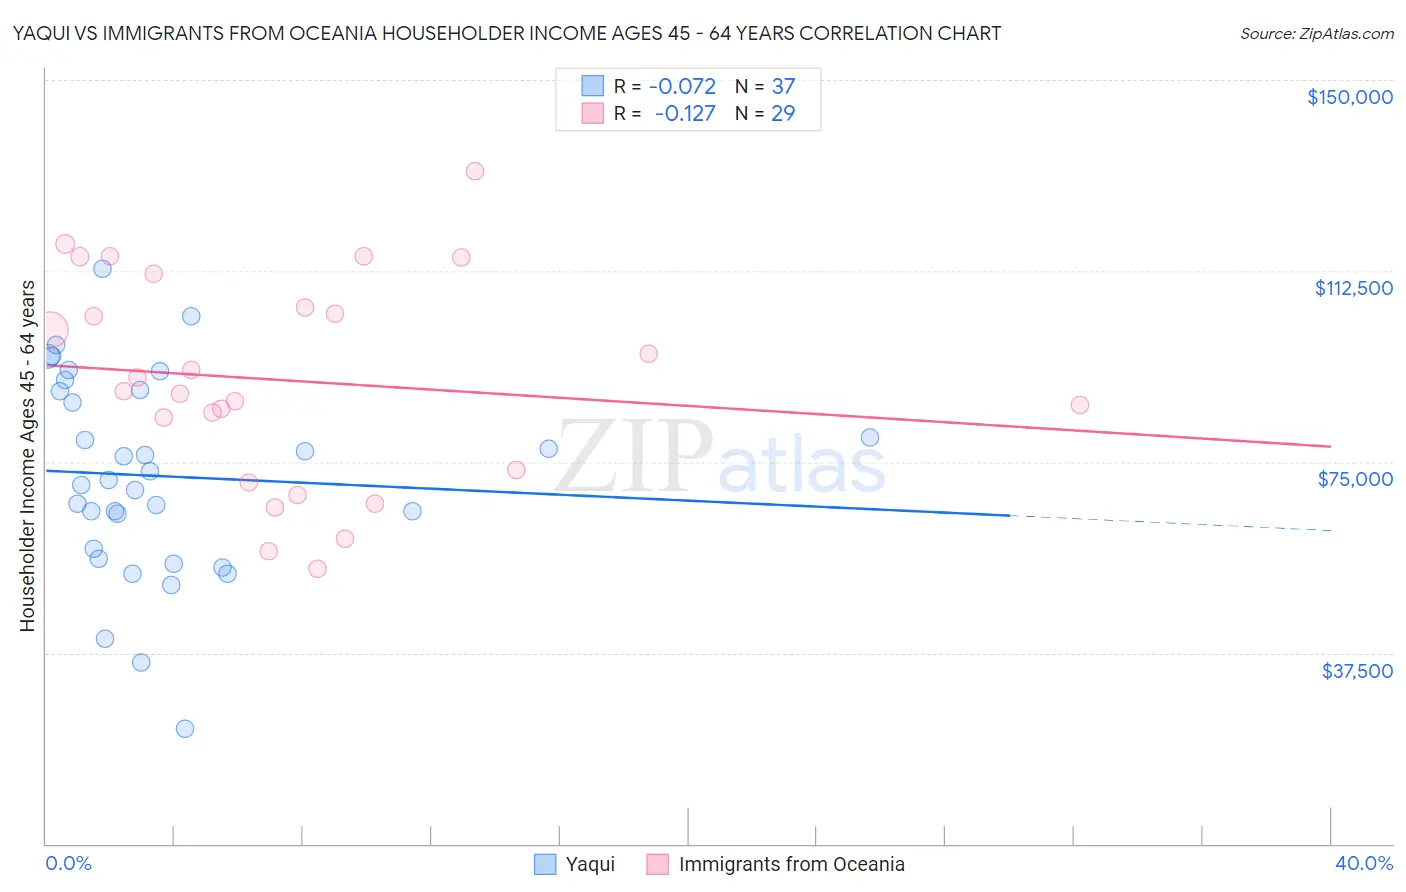
Yaqui vs Immigrants from Oceania Householder Income Ages 45 - 64 years Correlation Chart

The statistical analysis conducted on geographies consisting of 107,688,425 people shows a slight negative correlation between the proportion of Yaqui and household income with householder between the ages 45 and 64 in the United States with a correlation coefficient (R) of -0.072 and weighted average of $86,914. Similarly, the statistical analysis conducted on geographies consisting of 305,099,752 people shows a poor negative correlation between the proportion of Immigrants from Oceania and household income with householder between the ages 45 and 64 in the United States with a correlation coefficient (R) of -0.127 and weighted average of $103,705, a difference of 19.3%.
Yaqui vs Immigrants from Oceania Householder Income Ages 45 - 64 years

Householder Income Ages 45 - 64 years Correlation Summary

MeasurementYaquiImmigrants from Oceania
Minimum$22,708$53,935
Maximum$112,855$132,083
Range$90,147$78,148
Mean$72,181$90,991
Median$71,412$88,770
Interquartile 25% (IQ1)$56,921$72,125
Interquartile 75% (IQ3)$88,961$108,595
Interquartile Range (IQR)$32,041$36,470
Standard Deviation (Sample)$19,685$20,662
Standard Deviation (Population)$19,417$20,302

Similar Demographics by Householder Income Ages 45 - 64 years

Demographics Similar to Yaqui by Householder Income Ages 45 - 64 years

In terms of householder income ages 45 - 64 years, the demographic groups most similar to Yaqui are Senegalese ($86,897, a difference of 0.020%), Immigrants from Somalia ($86,987, a difference of 0.080%), Yakama ($86,992, a difference of 0.090%), Mexican ($86,816, a difference of 0.11%), and Immigrants from Jamaica ($87,035, a difference of 0.14%).
DemographicsRating | RankHouseholder Income Ages 45 - 64 years
Iroquois
0.1
/100
|
#274
Tragic
$87,255
Immigrants | Belize
0.1
/100
|
#275
Tragic
$87,229
Immigrants | Latin America
0.1
/100
|
#276
Tragic
$87,219
Cree
0.1
/100
|
#277
Tragic
$87,185
Immigrants | Jamaica
0.1
/100
|
#278
Tragic
$87,035
Yakama
0.1
/100
|
#279
Tragic
$86,992
Immigrants | Somalia
0.1
/100
|
#280
Tragic
$86,987
Yaqui
0.1
/100
|
#281
Tragic
$86,914
Senegalese
0.1
/100
|
#282
Tragic
$86,897
Mexicans
0.1
/100
|
#283
Tragic
$86,816
Central American Indians
0.1
/100
|
#284
Tragic
$86,764
Blackfeet
0.1
/100
|
#285
Tragic
$86,595
Immigrants | Guatemala
0.1
/100
|
#286
Tragic
$86,573
Bangladeshis
0.1
/100
|
#287
Tragic
$86,402
Immigrants | St. Vincent and the Grenadines
0.1
/100
|
#288
Tragic
$86,394

Demographics Similar to Immigrants from Oceania by Householder Income Ages 45 - 64 years

In terms of householder income ages 45 - 64 years, the demographic groups most similar to Immigrants from Oceania are Norwegian ($103,682, a difference of 0.020%), Ethiopian ($103,736, a difference of 0.030%), Immigrants from Uganda ($103,584, a difference of 0.12%), Luxembourger ($103,536, a difference of 0.16%), and Serbian ($103,522, a difference of 0.18%).
DemographicsRating | RankHouseholder Income Ages 45 - 64 years
Lebanese
90.1
/100
|
#132
Exceptional
$104,734
Arabs
89.3
/100
|
#133
Excellent
$104,566
Canadians
89.3
/100
|
#134
Excellent
$104,560
Brazilians
88.6
/100
|
#135
Excellent
$104,408
Taiwanese
87.4
/100
|
#136
Excellent
$104,180
Hungarians
85.8
/100
|
#137
Excellent
$103,913
Ethiopians
84.7
/100
|
#138
Excellent
$103,736
Immigrants | Oceania
84.5
/100
|
#139
Excellent
$103,705
Norwegians
84.3
/100
|
#140
Excellent
$103,682
Immigrants | Uganda
83.7
/100
|
#141
Excellent
$103,584
Luxembourgers
83.3
/100
|
#142
Excellent
$103,536
Serbians
83.2
/100
|
#143
Excellent
$103,522
Czechs
83.1
/100
|
#144
Excellent
$103,507
Ugandans
82.9
/100
|
#145
Excellent
$103,472
Immigrants | Chile
82.5
/100
|
#146
Excellent
$103,412