Yaqui vs Immigrants from Cabo Verde Median Household Income
COMPARE
Yaqui
Immigrants from Cabo Verde
Median Household Income
Median Household Income Comparison
Yaqui
Immigrants from Cabo Verde
$74,596
MEDIAN HOUSEHOLD INCOME
0.1/ 100
METRIC RATING
284th/ 347
METRIC RANK
$73,515
MEDIAN HOUSEHOLD INCOME
0.1/ 100
METRIC RATING
293rd/ 347
METRIC RANK
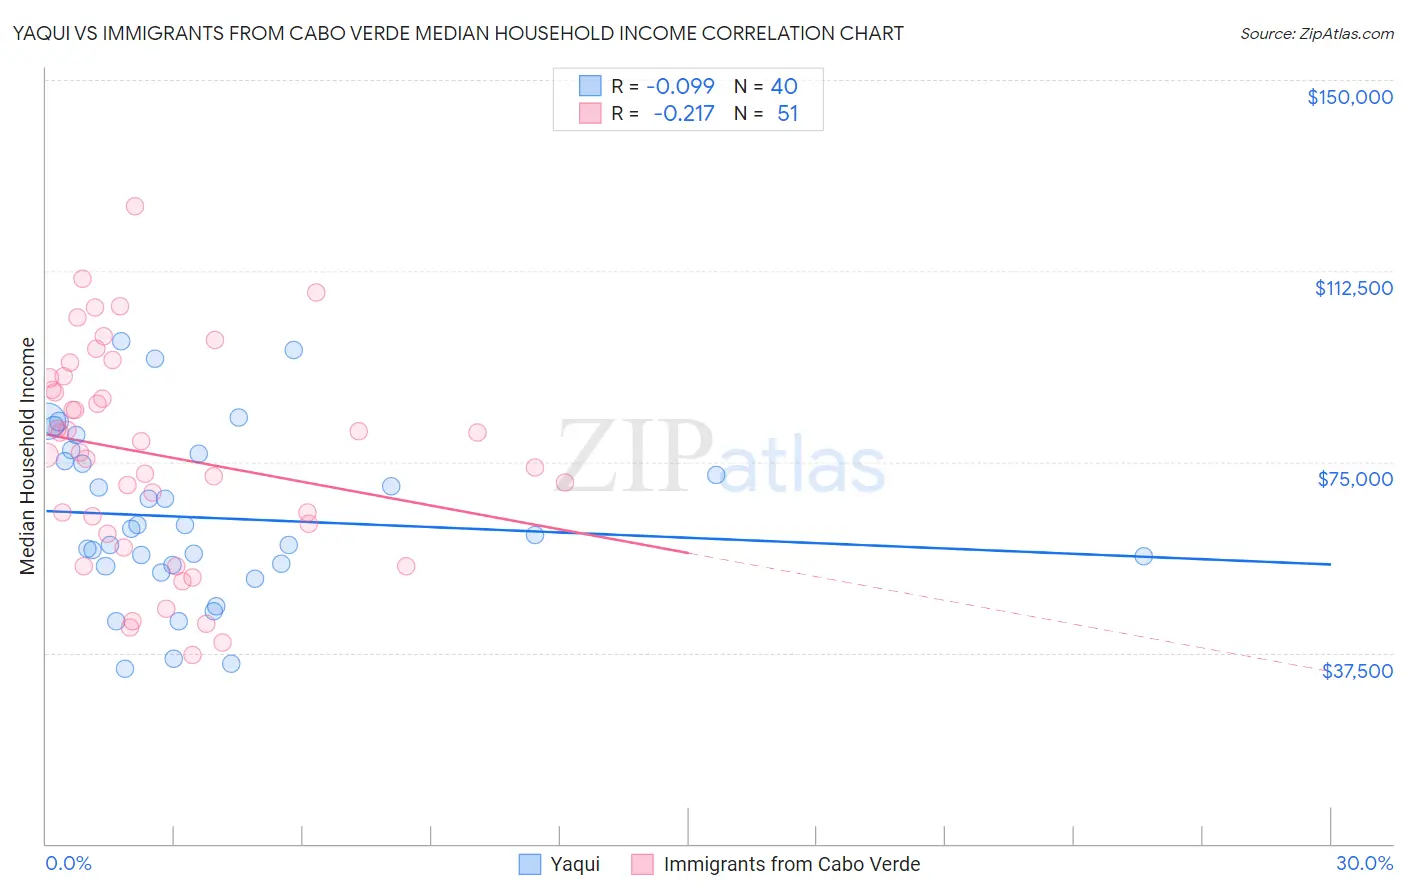
Yaqui vs Immigrants from Cabo Verde Median Household Income Correlation Chart
The statistical analysis conducted on geographies consisting of 107,719,305 people shows a slight negative correlation between the proportion of Yaqui and median household income in the United States with a correlation coefficient (R) of -0.099 and weighted average of $74,596. Similarly, the statistical analysis conducted on geographies consisting of 38,130,720 people shows a weak negative correlation between the proportion of Immigrants from Cabo Verde and median household income in the United States with a correlation coefficient (R) of -0.217 and weighted average of $73,515, a difference of 1.5%.
Median Household Income Correlation Summary
| Measurement | Yaqui | Immigrants from Cabo Verde |
| Minimum | $34,415 | $37,158 |
| Maximum | $98,754 | $125,130 |
| Range | $64,339 | $87,972 |
| Mean | $64,033 | $76,217 |
| Median | $61,231 | $76,886 |
| Interquartile 25% (IQ1) | $54,573 | $60,971 |
| Interquartile 75% (IQ3) | $75,863 | $91,527 |
| Interquartile Range (IQR) | $21,290 | $30,555 |
| Standard Deviation (Sample) | $16,401 | $20,748 |
| Standard Deviation (Population) | $16,195 | $20,544 |
Demographics Similar to Yaqui and Immigrants from Cabo Verde by Median Household Income
In terms of median household income, the demographic groups most similar to Yaqui are Cree ($74,685, a difference of 0.12%), Mexican ($74,399, a difference of 0.26%), Central American Indian ($74,847, a difference of 0.34%), Immigrants from Liberia ($74,896, a difference of 0.40%), and Immigrants from Somalia ($74,300, a difference of 0.40%). Similarly, the demographic groups most similar to Immigrants from Cabo Verde are Blackfeet ($73,509, a difference of 0.010%), Cuban ($73,392, a difference of 0.17%), Haitian ($73,306, a difference of 0.29%), Comanche ($73,747, a difference of 0.31%), and Hispanic or Latino ($73,823, a difference of 0.42%).
| Demographics | Rating | Rank | Median Household Income |
| Osage | 0.2 /100 | #278 | Tragic $75,240 |
| Immigrants | Guatemala | 0.2 /100 | #279 | Tragic $75,123 |
| Senegalese | 0.2 /100 | #280 | Tragic $74,999 |
| Immigrants | Liberia | 0.1 /100 | #281 | Tragic $74,896 |
| Central American Indians | 0.1 /100 | #282 | Tragic $74,847 |
| Cree | 0.1 /100 | #283 | Tragic $74,685 |
| Yaqui | 0.1 /100 | #284 | Tragic $74,596 |
| Mexicans | 0.1 /100 | #285 | Tragic $74,399 |
| Immigrants | Somalia | 0.1 /100 | #286 | Tragic $74,300 |
| Iroquois | 0.1 /100 | #287 | Tragic $74,279 |
| Immigrants | Central America | 0.1 /100 | #288 | Tragic $74,217 |
| Fijians | 0.1 /100 | #289 | Tragic $74,205 |
| Bangladeshis | 0.1 /100 | #290 | Tragic $74,112 |
| Hispanics or Latinos | 0.1 /100 | #291 | Tragic $73,823 |
| Comanche | 0.1 /100 | #292 | Tragic $73,747 |
| Immigrants | Cabo Verde | 0.1 /100 | #293 | Tragic $73,515 |
| Blackfeet | 0.1 /100 | #294 | Tragic $73,509 |
| Cubans | 0.1 /100 | #295 | Tragic $73,392 |
| Haitians | 0.1 /100 | #296 | Tragic $73,306 |
| Immigrants | Mexico | 0.0 /100 | #297 | Tragic $73,160 |
| Paiute | 0.0 /100 | #298 | Tragic $72,959 |