Yaqui vs Cherokee Median Earnings
COMPARE
Yaqui
Cherokee
Median Earnings
Median Earnings Comparison
Yaqui
Cherokee
$40,647
MEDIAN EARNINGS
0.0/ 100
METRIC RATING
306th/ 347
METRIC RANK
$41,252
MEDIAN EARNINGS
0.1/ 100
METRIC RATING
296th/ 347
METRIC RANK
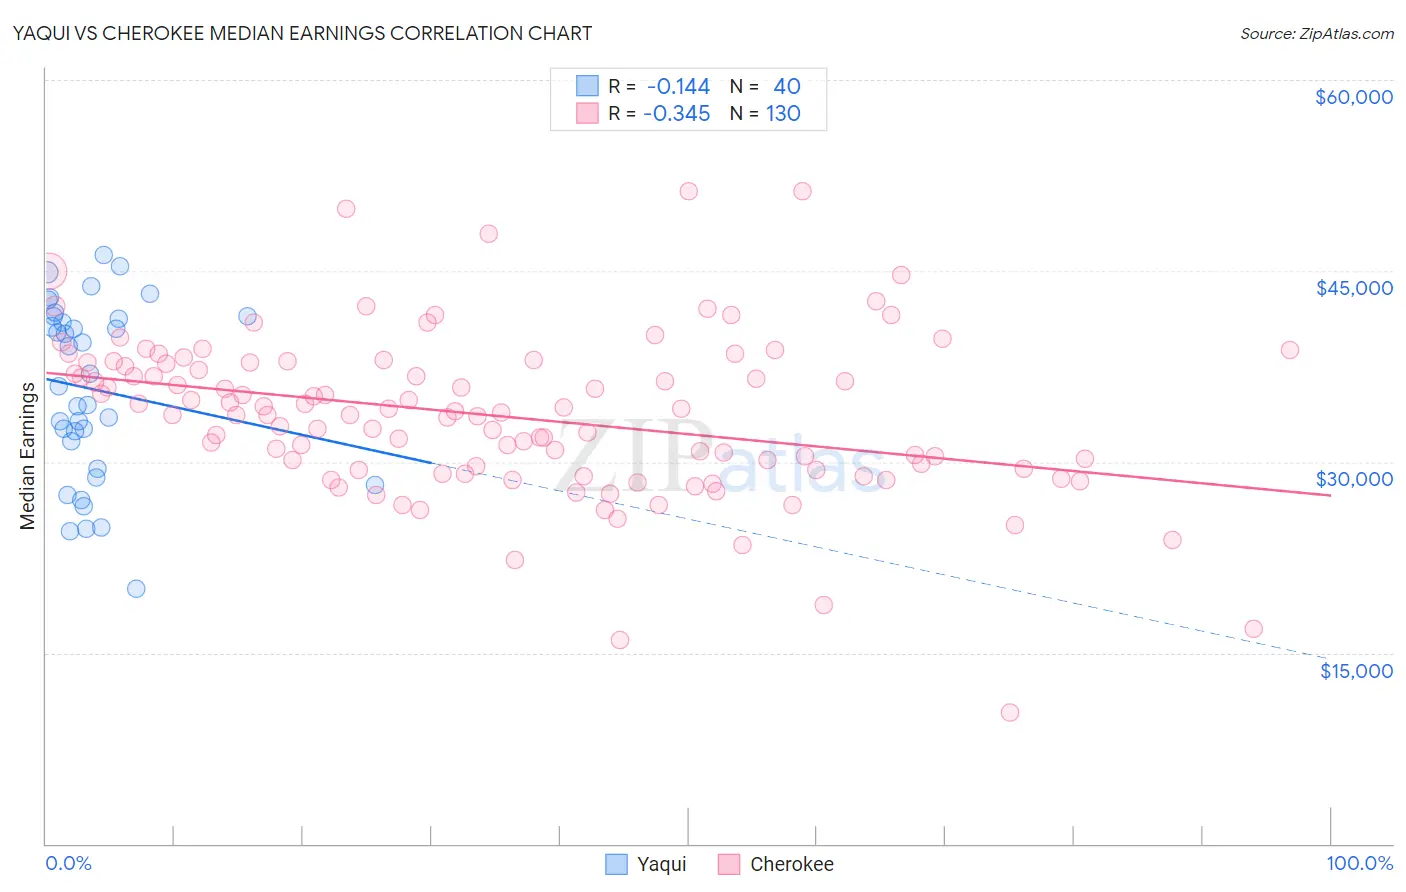
Yaqui vs Cherokee Median Earnings Correlation Chart
The statistical analysis conducted on geographies consisting of 107,736,593 people shows a poor negative correlation between the proportion of Yaqui and median earnings in the United States with a correlation coefficient (R) of -0.144 and weighted average of $40,647. Similarly, the statistical analysis conducted on geographies consisting of 493,557,174 people shows a mild negative correlation between the proportion of Cherokee and median earnings in the United States with a correlation coefficient (R) of -0.345 and weighted average of $41,252, a difference of 1.5%.
Median Earnings Correlation Summary
| Measurement | Yaqui | Cherokee |
| Minimum | $20,058 | $10,267 |
| Maximum | $46,273 | $51,250 |
| Range | $26,215 | $40,983 |
| Mean | $35,713 | $33,603 |
| Median | $36,396 | $33,784 |
| Interquartile 25% (IQ1) | $30,515 | $29,375 |
| Interquartile 75% (IQ3) | $41,344 | $37,767 |
| Interquartile Range (IQR) | $10,829 | $8,392 |
| Standard Deviation (Sample) | $6,900 | $6,429 |
| Standard Deviation (Population) | $6,813 | $6,404 |
Demographics Similar to Yaqui and Cherokee by Median Earnings
In terms of median earnings, the demographic groups most similar to Yaqui are Honduran ($40,638, a difference of 0.020%), Chickasaw ($40,672, a difference of 0.060%), Cuban ($40,619, a difference of 0.070%), Immigrants from Haiti ($40,550, a difference of 0.24%), and Immigrants from Guatemala ($40,851, a difference of 0.50%). Similarly, the demographic groups most similar to Cherokee are Bangladeshi ($41,263, a difference of 0.030%), Potawatomi ($41,288, a difference of 0.090%), Guatemalan ($41,205, a difference of 0.11%), Immigrants from Zaire ($41,325, a difference of 0.18%), and Immigrants from Micronesia ($41,133, a difference of 0.29%).
| Demographics | Rating | Rank | Median Earnings |
| Central American Indians | 0.1 /100 | #291 | Tragic $41,474 |
| U.S. Virgin Islanders | 0.1 /100 | #292 | Tragic $41,448 |
| Immigrants | Zaire | 0.1 /100 | #293 | Tragic $41,325 |
| Potawatomi | 0.1 /100 | #294 | Tragic $41,288 |
| Bangladeshis | 0.1 /100 | #295 | Tragic $41,263 |
| Cherokee | 0.1 /100 | #296 | Tragic $41,252 |
| Guatemalans | 0.1 /100 | #297 | Tragic $41,205 |
| Immigrants | Micronesia | 0.1 /100 | #298 | Tragic $41,133 |
| Immigrants | Caribbean | 0.1 /100 | #299 | Tragic $41,119 |
| Ute | 0.1 /100 | #300 | Tragic $41,051 |
| Immigrants | Latin America | 0.1 /100 | #301 | Tragic $41,049 |
| Shoshone | 0.0 /100 | #302 | Tragic $40,932 |
| Haitians | 0.0 /100 | #303 | Tragic $40,918 |
| Immigrants | Guatemala | 0.0 /100 | #304 | Tragic $40,851 |
| Chickasaw | 0.0 /100 | #305 | Tragic $40,672 |
| Yaqui | 0.0 /100 | #306 | Tragic $40,647 |
| Hondurans | 0.0 /100 | #307 | Tragic $40,638 |
| Cubans | 0.0 /100 | #308 | Tragic $40,619 |
| Immigrants | Haiti | 0.0 /100 | #309 | Tragic $40,550 |
| Apache | 0.0 /100 | #310 | Tragic $40,388 |
| Hispanics or Latinos | 0.0 /100 | #311 | Tragic $40,288 |