Yaqui vs Bolivian Median Female Earnings
COMPARE
Yaqui
Bolivian
Median Female Earnings
Median Female Earnings Comparison
Yaqui
Bolivians
$34,943
MEDIAN FEMALE EARNINGS
0.0/ 100
METRIC RATING
312th/ 347
METRIC RANK
$43,445
MEDIAN FEMALE EARNINGS
100.0/ 100
METRIC RATING
47th/ 347
METRIC RANK
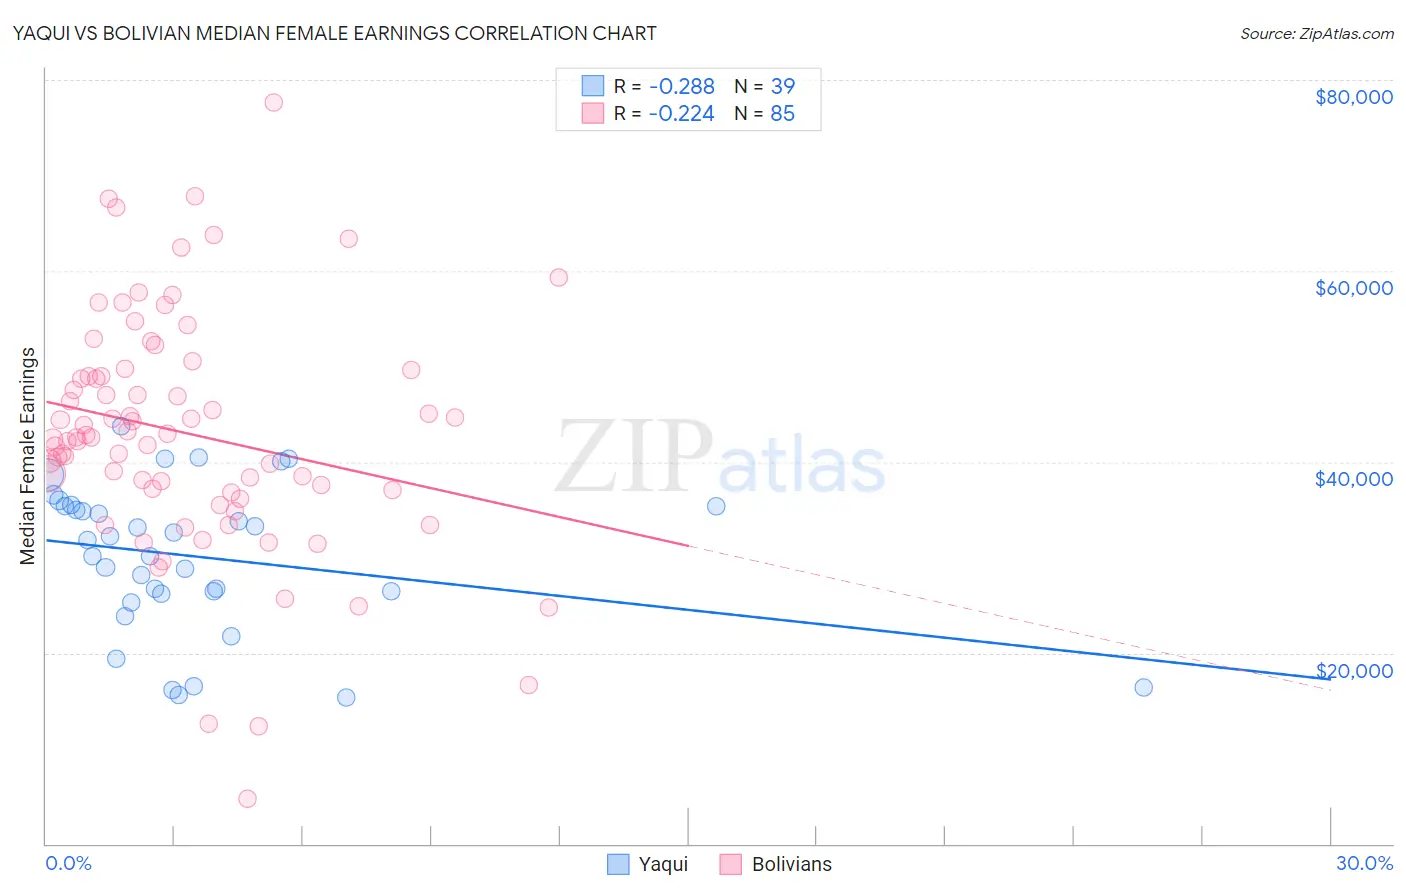
Yaqui vs Bolivian Median Female Earnings Correlation Chart
The statistical analysis conducted on geographies consisting of 107,698,351 people shows a weak negative correlation between the proportion of Yaqui and median female earnings in the United States with a correlation coefficient (R) of -0.288 and weighted average of $34,943. Similarly, the statistical analysis conducted on geographies consisting of 184,667,503 people shows a weak negative correlation between the proportion of Bolivians and median female earnings in the United States with a correlation coefficient (R) of -0.224 and weighted average of $43,445, a difference of 24.3%.
Median Female Earnings Correlation Summary
| Measurement | Yaqui | Bolivian |
| Minimum | $15,284 | $4,682 |
| Maximum | $43,787 | $77,679 |
| Range | $28,503 | $72,997 |
| Mean | $30,052 | $42,989 |
| Median | $31,854 | $42,606 |
| Interquartile 25% (IQ1) | $26,190 | $36,934 |
| Interquartile 75% (IQ3) | $35,336 | $49,332 |
| Interquartile Range (IQR) | $9,146 | $12,397 |
| Standard Deviation (Sample) | $7,719 | $12,507 |
| Standard Deviation (Population) | $7,619 | $12,433 |
Similar Demographics by Median Female Earnings
Demographics Similar to Yaqui by Median Female Earnings
In terms of median female earnings, the demographic groups most similar to Yaqui are Cuban ($34,942, a difference of 0.0%), Ute ($34,960, a difference of 0.050%), Apache ($34,895, a difference of 0.14%), Chippewa ($35,003, a difference of 0.17%), and Honduran ($35,013, a difference of 0.20%).
| Demographics | Rating | Rank | Median Female Earnings |
| Bahamians | 0.0 /100 | #305 | Tragic $35,125 |
| Fijians | 0.0 /100 | #306 | Tragic $35,114 |
| Sioux | 0.0 /100 | #307 | Tragic $35,063 |
| Immigrants | Bahamas | 0.0 /100 | #308 | Tragic $35,027 |
| Hondurans | 0.0 /100 | #309 | Tragic $35,013 |
| Chippewa | 0.0 /100 | #310 | Tragic $35,003 |
| Ute | 0.0 /100 | #311 | Tragic $34,960 |
| Yaqui | 0.0 /100 | #312 | Tragic $34,943 |
| Cubans | 0.0 /100 | #313 | Tragic $34,942 |
| Apache | 0.0 /100 | #314 | Tragic $34,895 |
| Pennsylvania Germans | 0.0 /100 | #315 | Tragic $34,802 |
| Cherokee | 0.0 /100 | #316 | Tragic $34,742 |
| Potawatomi | 0.0 /100 | #317 | Tragic $34,739 |
| Immigrants | Yemen | 0.0 /100 | #318 | Tragic $34,693 |
| Shoshone | 0.0 /100 | #319 | Tragic $34,677 |
Demographics Similar to Bolivians by Median Female Earnings
In terms of median female earnings, the demographic groups most similar to Bolivians are Immigrants from Bolivia ($43,467, a difference of 0.050%), Immigrants from Indonesia ($43,412, a difference of 0.070%), Immigrants from Serbia ($43,385, a difference of 0.14%), Immigrants from Europe ($43,523, a difference of 0.18%), and Immigrants from Uzbekistan ($43,363, a difference of 0.19%).
| Demographics | Rating | Rank | Median Female Earnings |
| Immigrants | Malaysia | 100.0 /100 | #40 | Exceptional $43,835 |
| Bhutanese | 100.0 /100 | #41 | Exceptional $43,648 |
| Immigrants | Denmark | 100.0 /100 | #42 | Exceptional $43,646 |
| Bulgarians | 100.0 /100 | #43 | Exceptional $43,638 |
| Immigrants | Czechoslovakia | 100.0 /100 | #44 | Exceptional $43,571 |
| Immigrants | Europe | 100.0 /100 | #45 | Exceptional $43,523 |
| Immigrants | Bolivia | 100.0 /100 | #46 | Exceptional $43,467 |
| Bolivians | 100.0 /100 | #47 | Exceptional $43,445 |
| Immigrants | Indonesia | 100.0 /100 | #48 | Exceptional $43,412 |
| Immigrants | Serbia | 100.0 /100 | #49 | Exceptional $43,385 |
| Immigrants | Uzbekistan | 100.0 /100 | #50 | Exceptional $43,363 |
| Maltese | 100.0 /100 | #51 | Exceptional $43,357 |
| Immigrants | Lithuania | 99.9 /100 | #52 | Exceptional $43,317 |
| Immigrants | Eastern Europe | 99.9 /100 | #53 | Exceptional $43,309 |
| Australians | 99.9 /100 | #54 | Exceptional $43,308 |