Yakama vs Fijian Householder Income Over 65 years
COMPARE
Yakama
Fijian
Householder Income Over 65 years
Householder Income Over 65 years Comparison
Yakama
Fijians
$56,234
HOUSEHOLDER INCOME OVER 65 YEARS
0.7/ 100
METRIC RATING
247th/ 347
METRIC RANK
$56,768
HOUSEHOLDER INCOME OVER 65 YEARS
1.2/ 100
METRIC RATING
238th/ 347
METRIC RANK
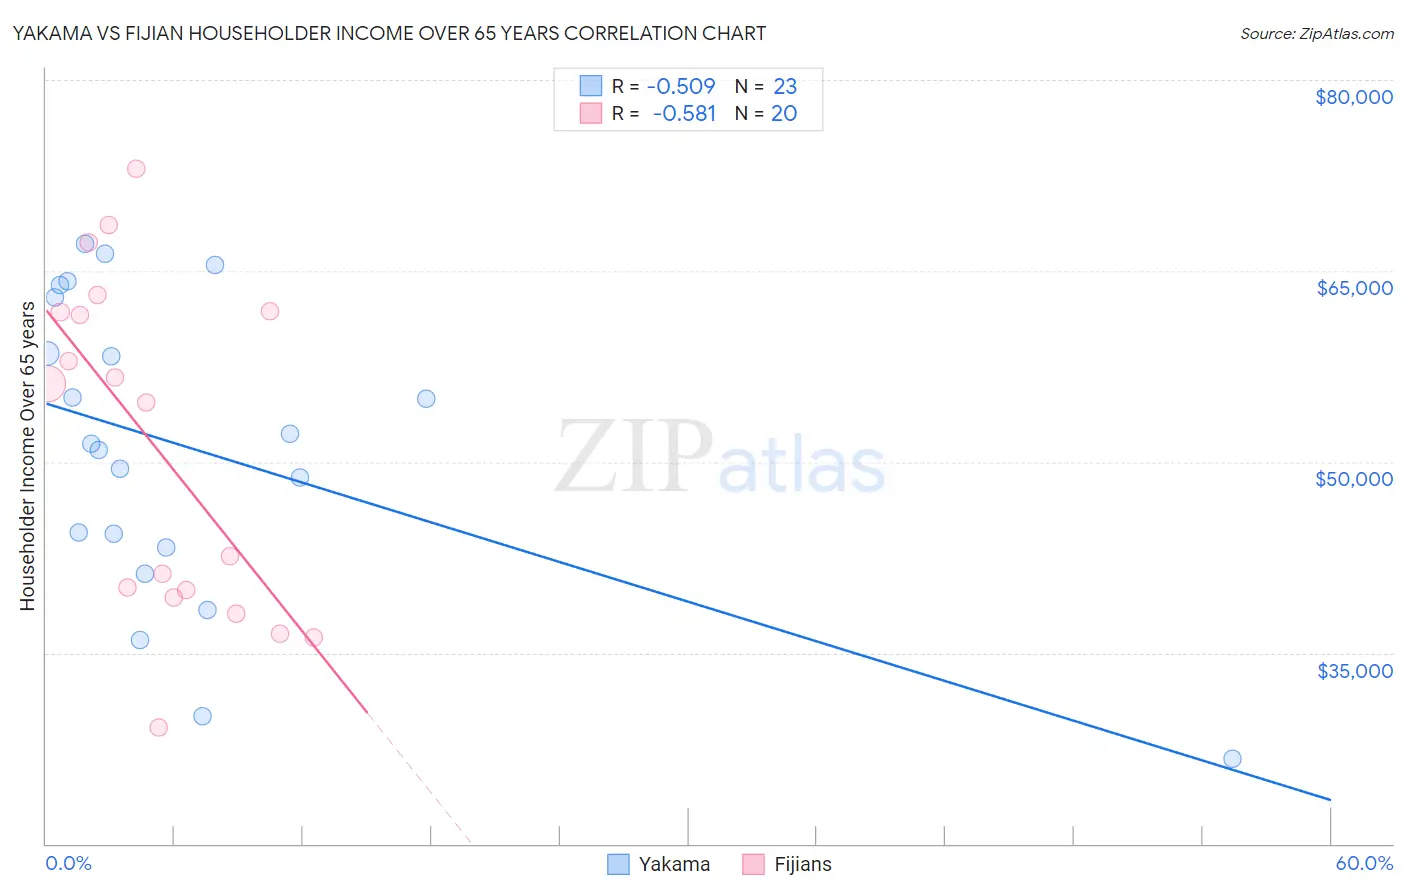
Yakama vs Fijian Householder Income Over 65 years Correlation Chart
The statistical analysis conducted on geographies consisting of 19,889,958 people shows a substantial negative correlation between the proportion of Yakama and household income with householder over the age of 65 in the United States with a correlation coefficient (R) of -0.509 and weighted average of $56,234. Similarly, the statistical analysis conducted on geographies consisting of 55,863,642 people shows a substantial negative correlation between the proportion of Fijians and household income with householder over the age of 65 in the United States with a correlation coefficient (R) of -0.581 and weighted average of $56,768, a difference of 0.95%.
Householder Income Over 65 years Correlation Summary
| Measurement | Yakama | Fijian |
| Minimum | $26,667 | $29,091 |
| Maximum | $67,099 | $72,983 |
| Range | $40,432 | $43,892 |
| Mean | $51,039 | $51,272 |
| Median | $51,401 | $55,405 |
| Interquartile 25% (IQ1) | $43,321 | $39,651 |
| Interquartile 75% (IQ3) | $62,905 | $61,780 |
| Interquartile Range (IQR) | $19,584 | $22,129 |
| Standard Deviation (Sample) | $11,672 | $13,144 |
| Standard Deviation (Population) | $11,415 | $12,811 |
Demographics Similar to Yakama and Fijians by Householder Income Over 65 years
In terms of householder income over 65 years, the demographic groups most similar to Yakama are Central American ($56,321, a difference of 0.15%), Vietnamese ($56,143, a difference of 0.16%), Immigrants from Uzbekistan ($56,331, a difference of 0.17%), Hmong ($56,339, a difference of 0.19%), and Guyanese ($56,351, a difference of 0.21%). Similarly, the demographic groups most similar to Fijians are Immigrants from Laos ($56,722, a difference of 0.080%), Subsaharan African ($56,615, a difference of 0.27%), Immigrants from Panama ($56,944, a difference of 0.31%), Immigrants from Uruguay ($56,975, a difference of 0.36%), and Spanish American ($57,021, a difference of 0.45%).
| Demographics | Rating | Rank | Householder Income Over 65 years |
| Immigrants | Venezuela | 2.3 /100 | #232 | Tragic $57,371 |
| Immigrants | Western Africa | 1.7 /100 | #233 | Tragic $57,119 |
| Immigrants | Burma/Myanmar | 1.7 /100 | #234 | Tragic $57,114 |
| Spanish Americans | 1.6 /100 | #235 | Tragic $57,021 |
| Immigrants | Uruguay | 1.5 /100 | #236 | Tragic $56,975 |
| Immigrants | Panama | 1.5 /100 | #237 | Tragic $56,944 |
| Fijians | 1.2 /100 | #238 | Tragic $56,768 |
| Immigrants | Laos | 1.2 /100 | #239 | Tragic $56,722 |
| Sub-Saharan Africans | 1.0 /100 | #240 | Tragic $56,615 |
| Immigrants | Guyana | 0.9 /100 | #241 | Tragic $56,495 |
| Yaqui | 0.8 /100 | #242 | Tragic $56,417 |
| Guyanese | 0.8 /100 | #243 | Tragic $56,351 |
| Hmong | 0.8 /100 | #244 | Tragic $56,339 |
| Immigrants | Uzbekistan | 0.8 /100 | #245 | Tragic $56,331 |
| Central Americans | 0.8 /100 | #246 | Tragic $56,321 |
| Yakama | 0.7 /100 | #247 | Tragic $56,234 |
| Vietnamese | 0.6 /100 | #248 | Tragic $56,143 |
| Mexican American Indians | 0.6 /100 | #249 | Tragic $56,089 |
| Immigrants | Bosnia and Herzegovina | 0.5 /100 | #250 | Tragic $55,986 |
| Immigrants | Portugal | 0.5 /100 | #251 | Tragic $55,924 |
| Osage | 0.4 /100 | #252 | Tragic $55,677 |