White/Caucasian vs Guamanian/Chamorro Householder Income Under 25 years

COMPARE

White/Caucasian
Race
Ancestry
AfghanAfricanAlaska NativeAlaskan AthabascanAlbanianAleutAlsatianAmericanApacheArabArapahoArgentineanArmenianAssyrian/Chaldean/SyriacAustralianAustrianBahamianBangladeshiBarbadianBasqueBelgianBelizeanBermudanBhutaneseBlackfeetBolivianBrazilianBritishBritish West IndianBulgarianBurmeseCajunCambodianCanadianCape VerdeanCarpatho RusynCelticCentral AmericanCentral American IndianCherokeeCheyenneChickasawChileanChineseChippewaChoctawColombianColvilleComancheCosta RicanCreeCreekCroatianCrowCubanCypriotCzechCzechoslovakianDanishDelawareDominicanDutchDutch West IndianEastern EuropeanEcuadorianEgyptianEnglishEstonianEthiopianEuropeanFijianFilipinoFinnishFrenchFrench American IndianFrench CanadianGermanGerman RussianGhanaianGreekGuatemalanGuyaneseHaitianHmongHonduranHopiHoumaHungarianIcelanderIndian (Asian)IndonesianInupiatIranianIraqiIrishIroquoisIsraeliItalianJamaicanJapaneseJordanianKenyanKiowaKoreanLaotianLatvianLebaneseLiberianLithuanianLumbeeLuxembourgerMacedonianMalaysianMalteseMarshalleseMenomineeMexicanMexican American IndianMongolianMoroccanNative HawaiianNavajoNepaleseNew ZealanderNicaraguanNigerianNorthern EuropeanNorwegianOkinawanOsageOttawaPaiutePakistaniPalestinianPanamanianParaguayanPennsylvania GermanPeruvianPimaPolishPortuguesePotawatomiPuebloPuerto RicanPuget Sound SalishRomanianRussianSalvadoranSamoanScandinavianScotch-IrishScottishSeminoleSenegaleseSerbianShoshoneSierra LeoneanSiouxSlavicSlovakSloveneSomaliSouth AfricanSouth AmericanSouth American IndianSoviet UnionSpaniardSpanishSpanish AmericanSpanish American IndianSri LankanSubsaharan AfricanSudaneseSwedishSwissSyrianTaiwaneseThaiTlingit-HaidaTohono O'OdhamTonganTrinidadian and TobagonianTsimshianTurkishU.S. Virgin IslanderUgandanUkrainianUruguayanUteVenezuelanVietnameseWelshWest IndianYakamaYaquiYugoslavianYumanYup'ikZimbabwean
Immigration
NonimmigrantsImmigrantsAfghanistanAfricaAlbaniaArgentinaArmeniaAsiaAustraliaAustriaBahamasBangladeshBarbadosBelarusBelgiumBelizeBoliviaBosnia and HerzegovinaBrazilBulgariaBurma/MyanmarCabo VerdeCambodiaCameroonCanadaCaribbeanCentral AmericaChileChinaColombiaCongoCosta RicaCroatiaCubaCzechoslovakiaDenmarkDominicaDominican RepublicEastern AfricaEastern AsiaEastern EuropeEcuadorEgyptEl SalvadorEnglandEritreaEthiopiaEuropeFijiFranceGermanyGhanaGreeceGrenadaGuatemalaGuyanaHaitiHondurasHong KongHungaryIndiaIndonesiaIranIraqIrelandIsraelItalyJamaicaJapanJordanKazakhstanKenyaKoreaKuwaitLaosLatin AmericaLatviaLebanonLiberiaLithuaniaMalaysiaMexicoMicronesiaMiddle AfricaMoldovaMoroccoNepalNetherlandsNicaraguaNigeriaNorth AmericaNorth MacedoniaNorthern AfricaNorthern EuropeNorwayOceaniaPakistanPanamaPeruPhilippinesPolandPortugalRomaniaRussiaSaudi ArabiaScotlandSenegalSerbiaSierra LeoneSingaporeSomaliaSouth AfricaSouth AmericaSouth Central AsiaSouth Eastern AsiaSouthern EuropeSpainSri LankaSt. Vincent and the GrenadinesSudanSwedenSwitzerlandSyriaTaiwanThailandTrinidad and TobagoTurkeyUgandaUkraineUruguayUzbekistanVenezuelaVietnamWest IndiesWestern AfricaWestern AsiaWestern EuropeYemenZaireZimbabweAzores
Guamanian/Chamorro
Race
Ancestry
AfghanAfricanAlaska NativeAlaskan AthabascanAlbanianAleutAlsatianAmericanApacheArabArapahoArgentineanArmenianAssyrian/Chaldean/SyriacAustralianAustrianBahamianBangladeshiBarbadianBasqueBelgianBelizeanBermudanBhutaneseBlackfeetBolivianBrazilianBritishBritish West IndianBulgarianBurmeseCajunCambodianCanadianCape VerdeanCarpatho RusynCelticCentral AmericanCentral American IndianCherokeeCheyenneChickasawChileanChineseChippewaChoctawColombianColvilleComancheCosta RicanCreeCreekCroatianCrowCubanCypriotCzechCzechoslovakianDanishDelawareDominicanDutchDutch West IndianEastern EuropeanEcuadorianEgyptianEnglishEstonianEthiopianEuropeanFijianFilipinoFinnishFrenchFrench American IndianFrench CanadianGermanGerman RussianGhanaianGreekGuamanian/ChamorroGuatemalanGuyaneseHaitianHmongHonduranHopiHoumaHungarianIcelanderIndian (Asian)IndonesianInupiatIranianIraqiIrishIroquoisIsraeliItalianJamaicanJapaneseJordanianKenyanKiowaKoreanLaotianLatvianLebaneseLiberianLithuanianLumbeeLuxembourgerMacedonianMalaysianMalteseMarshalleseMenomineeMexicanMexican American IndianMongolianMoroccanNative HawaiianNavajoNepaleseNew ZealanderNicaraguanNigerianNorthern EuropeanNorwegianOkinawanOsageOttawaPaiutePakistaniPalestinianPanamanianParaguayanPennsylvania GermanPeruvianPimaPolishPortuguesePotawatomiPuebloPuerto RicanPuget Sound SalishRomanianRussianSalvadoranSamoanScandinavianScotch-IrishScottishSeminoleSenegaleseSerbianShoshoneSierra LeoneanSiouxSlavicSlovakSloveneSomaliSouth AfricanSouth AmericanSouth American IndianSoviet UnionSpaniardSpanishSpanish AmericanSpanish American IndianSri LankanSubsaharan AfricanSudaneseSwedishSwissSyrianTaiwaneseThaiTlingit-HaidaTohono O'OdhamTonganTrinidadian and TobagonianTsimshianTurkishU.S. Virgin IslanderUgandanUkrainianUruguayanUteVenezuelanVietnameseWelshWest IndianYakamaYaquiYugoslavianYumanYup'ikZimbabwean
Immigration
NonimmigrantsImmigrantsAfghanistanAfricaAlbaniaArgentinaArmeniaAsiaAustraliaAustriaBahamasBangladeshBarbadosBelarusBelgiumBelizeBoliviaBosnia and HerzegovinaBrazilBulgariaBurma/MyanmarCabo VerdeCambodiaCameroonCanadaCaribbeanCentral AmericaChileChinaColombiaCongoCosta RicaCroatiaCubaCzechoslovakiaDenmarkDominicaDominican RepublicEastern AfricaEastern AsiaEastern EuropeEcuadorEgyptEl SalvadorEnglandEritreaEthiopiaEuropeFijiFranceGermanyGhanaGreeceGrenadaGuatemalaGuyanaHaitiHondurasHong KongHungaryIndiaIndonesiaIranIraqIrelandIsraelItalyJamaicaJapanJordanKazakhstanKenyaKoreaKuwaitLaosLatin AmericaLatviaLebanonLiberiaLithuaniaMalaysiaMexicoMicronesiaMiddle AfricaMoldovaMoroccoNepalNetherlandsNicaraguaNigeriaNorth AmericaNorth MacedoniaNorthern AfricaNorthern EuropeNorwayOceaniaPakistanPanamaPeruPhilippinesPolandPortugalRomaniaRussiaSaudi ArabiaScotlandSenegalSerbiaSierra LeoneSingaporeSomaliaSouth AfricaSouth AmericaSouth Central AsiaSouth Eastern AsiaSouthern EuropeSpainSri LankaSt. Vincent and the GrenadinesSudanSwedenSwitzerlandSyriaTaiwanThailandTrinidad and TobagoTurkeyUgandaUkraineUruguayUzbekistanVenezuelaVietnamWest IndiesWestern AfricaWestern AsiaWestern EuropeYemenZaireZimbabweAzores
Householder Income Under 25 years
Income
Poverty
Unemployment
Labor Participation
Family Structure
Vehicle Availability
Education Level
Disability

Householder Income Under 25 years Comparison

Whites/Caucasians

Guamanians/Chamorros

Tragic
Exceptional
$50,336
HOUSEHOLDER INCOME UNDER 25 YEARS
1.1/ 100
METRIC RATING
258th/ 347
METRIC RANK
$53,423
HOUSEHOLDER INCOME UNDER 25 YEARS
95.3/ 100
METRIC RATING
120th/ 347
METRIC RANK

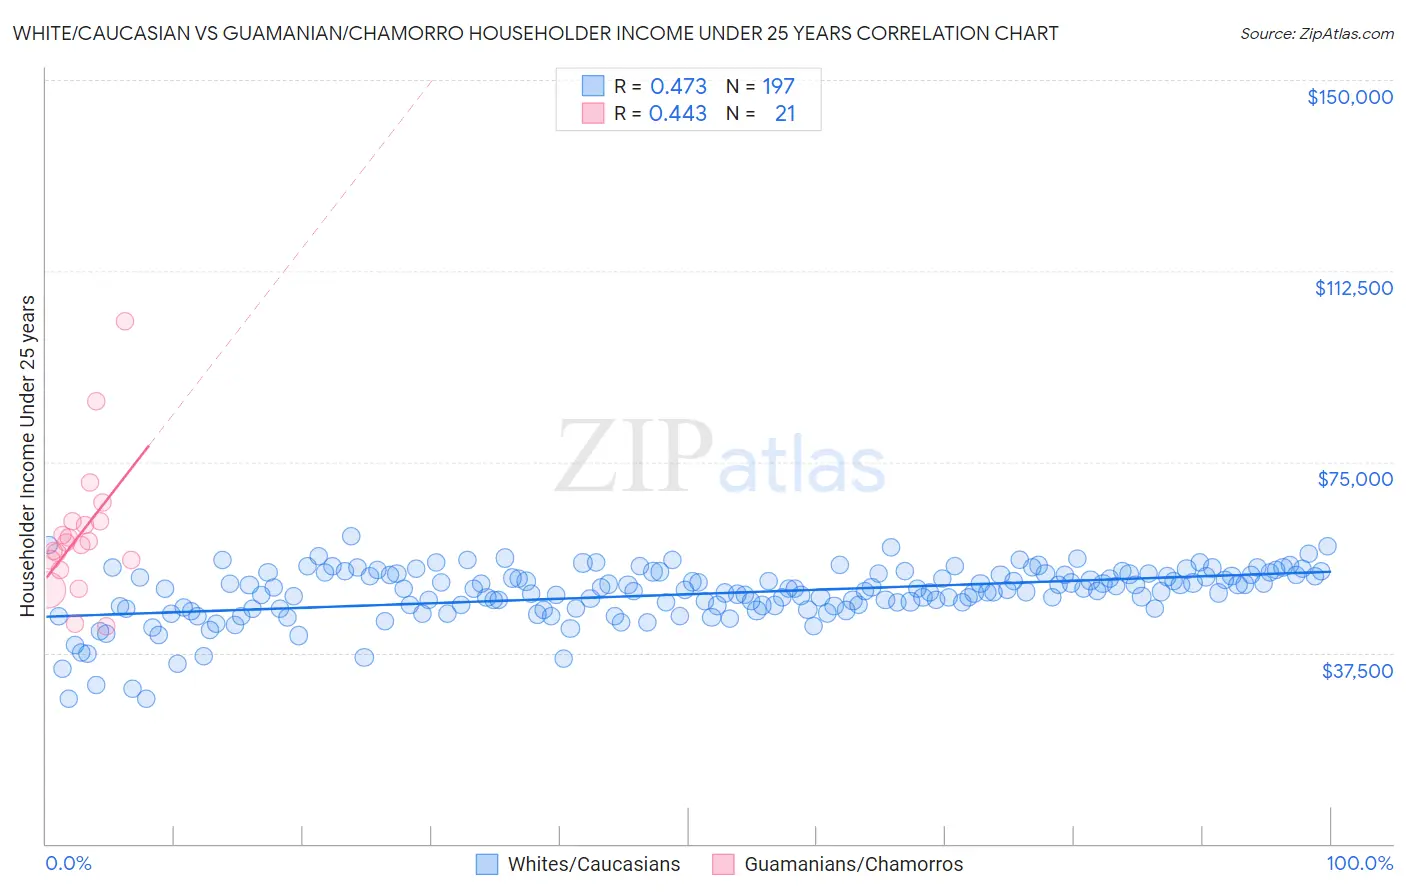
White/Caucasian vs Guamanian/Chamorro Householder Income Under 25 years Correlation Chart

The statistical analysis conducted on geographies consisting of 438,814,939 people shows a moderate positive correlation between the proportion of Whites/Caucasians and household income with householder under the age of 25 in the United States with a correlation coefficient (R) of 0.473 and weighted average of $50,336. Similarly, the statistical analysis conducted on geographies consisting of 200,760,858 people shows a moderate positive correlation between the proportion of Guamanians/Chamorros and household income with householder under the age of 25 in the United States with a correlation coefficient (R) of 0.443 and weighted average of $53,423, a difference of 6.1%.
White/Caucasian vs Guamanian/Chamorro Householder Income Under 25 years

Householder Income Under 25 years Correlation Summary

MeasurementWhite/CaucasianGuamanian/Chamorro
Minimum$28,432$42,829
Maximum$60,456$102,571
Range$32,024$59,742
Mean$49,043$60,959
Median$49,887$59,082
Interquartile 25% (IQ1)$46,371$54,739
Interquartile 75% (IQ3)$52,865$63,324
Interquartile Range (IQR)$6,494$8,585
Standard Deviation (Sample)$5,415$13,387
Standard Deviation (Population)$5,401$13,064

Similar Demographics by Householder Income Under 25 years

Demographics Similar to Whites/Caucasians by Householder Income Under 25 years

In terms of householder income under 25 years, the demographic groups most similar to Whites/Caucasians are Lebanese ($50,355, a difference of 0.040%), Immigrants from Dominica ($50,301, a difference of 0.070%), Aleut ($50,377, a difference of 0.080%), Immigrants from Cuba ($50,374, a difference of 0.080%), and Luxembourger ($50,379, a difference of 0.090%).
DemographicsRating | RankHouseholder Income Under 25 years
Celtics
1.4
/100
|
#251
Tragic
$50,447
Immigrants | Mexico
1.3
/100
|
#252
Tragic
$50,422
Immigrants | Haiti
1.2
/100
|
#253
Tragic
$50,398
Luxembourgers
1.2
/100
|
#254
Tragic
$50,379
Aleuts
1.2
/100
|
#255
Tragic
$50,377
Immigrants | Cuba
1.2
/100
|
#256
Tragic
$50,374
Lebanese
1.1
/100
|
#257
Tragic
$50,355
Whites/Caucasians
1.1
/100
|
#258
Tragic
$50,336
Immigrants | Dominica
1.0
/100
|
#259
Tragic
$50,301
Hispanics or Latinos
0.9
/100
|
#260
Tragic
$50,279
Hungarians
0.9
/100
|
#261
Tragic
$50,247
Haitians
0.8
/100
|
#262
Tragic
$50,231
Immigrants | Dominican Republic
0.8
/100
|
#263
Tragic
$50,204
Fijians
0.6
/100
|
#264
Tragic
$50,132
Belgians
0.6
/100
|
#265
Tragic
$50,113

Demographics Similar to Guamanians/Chamorros by Householder Income Under 25 years

In terms of householder income under 25 years, the demographic groups most similar to Guamanians/Chamorros are Italian ($53,426, a difference of 0.010%), Immigrants from Canada ($53,411, a difference of 0.020%), Immigrants from Ethiopia ($53,408, a difference of 0.030%), Immigrants from Iraq ($53,384, a difference of 0.070%), and Colombian ($53,357, a difference of 0.12%).
DemographicsRating | RankHouseholder Income Under 25 years
Romanians
97.2
/100
|
#113
Exceptional
$53,632
Immigrants | Sweden
97.1
/100
|
#114
Exceptional
$53,621
Immigrants | Albania
96.9
/100
|
#115
Exceptional
$53,597
Immigrants | Spain
96.6
/100
|
#116
Exceptional
$53,560
Lithuanians
96.6
/100
|
#117
Exceptional
$53,552
Immigrants | Switzerland
96.3
/100
|
#118
Exceptional
$53,528
Italians
95.4
/100
|
#119
Exceptional
$53,426
Guamanians/Chamorros
95.3
/100
|
#120
Exceptional
$53,423
Immigrants | Canada
95.2
/100
|
#121
Exceptional
$53,411
Immigrants | Ethiopia
95.2
/100
|
#122
Exceptional
$53,408
Immigrants | Iraq
94.9
/100
|
#123
Exceptional
$53,384
Colombians
94.6
/100
|
#124
Exceptional
$53,357
Pakistanis
94.1
/100
|
#125
Exceptional
$53,325
Immigrants | Serbia
94.1
/100
|
#126
Exceptional
$53,321
Immigrants | North America
93.9
/100
|
#127
Exceptional
$53,307