Ute vs Houma Median Male Earnings
COMPARE
Ute
Houma
Median Male Earnings
Median Male Earnings Comparison
Ute
Houma
$48,899
MEDIAN MALE EARNINGS
0.4/ 100
METRIC RATING
268th/ 347
METRIC RANK
$50,547
MEDIAN MALE EARNINGS
2.0/ 100
METRIC RATING
244th/ 347
METRIC RANK
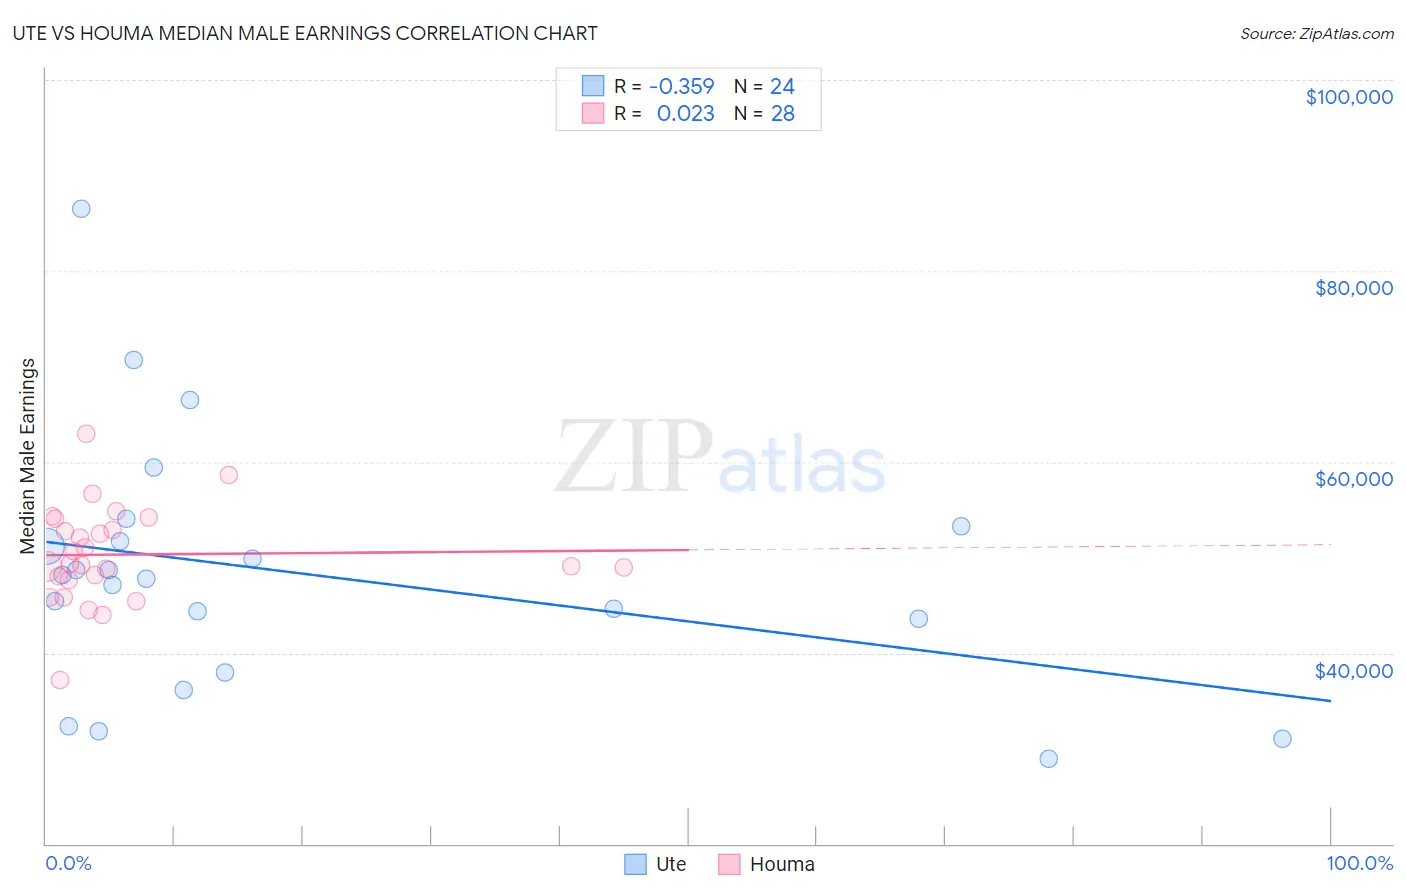
Ute vs Houma Median Male Earnings Correlation Chart
The statistical analysis conducted on geographies consisting of 55,657,801 people shows a mild negative correlation between the proportion of Ute and median male earnings in the United States with a correlation coefficient (R) of -0.359 and weighted average of $48,899. Similarly, the statistical analysis conducted on geographies consisting of 36,794,653 people shows no correlation between the proportion of Houma and median male earnings in the United States with a correlation coefficient (R) of 0.023 and weighted average of $50,547, a difference of 3.4%.
Median Male Earnings Correlation Summary
| Measurement | Ute | Houma |
| Minimum | $28,875 | $37,208 |
| Maximum | $86,490 | $62,981 |
| Range | $57,615 | $25,773 |
| Mean | $48,301 | $50,295 |
| Median | $47,968 | $49,219 |
| Interquartile 25% (IQ1) | $40,774 | $47,813 |
| Interquartile 75% (IQ3) | $52,454 | $53,443 |
| Interquartile Range (IQR) | $11,681 | $5,630 |
| Standard Deviation (Sample) | $13,224 | $5,065 |
| Standard Deviation (Population) | $12,945 | $4,974 |
Similar Demographics by Median Male Earnings
Demographics Similar to Ute by Median Male Earnings
In terms of median male earnings, the demographic groups most similar to Ute are Tsimshian ($48,836, a difference of 0.13%), Spanish American ($49,008, a difference of 0.22%), Somali ($49,025, a difference of 0.26%), Potawatomi ($48,768, a difference of 0.27%), and Cherokee ($48,669, a difference of 0.47%).
| Demographics | Rating | Rank | Median Male Earnings |
| Liberians | 0.6 /100 | #261 | Tragic $49,318 |
| Immigrants | West Indies | 0.6 /100 | #262 | Tragic $49,271 |
| Nicaraguans | 0.6 /100 | #263 | Tragic $49,215 |
| Immigrants | Middle Africa | 0.6 /100 | #264 | Tragic $49,201 |
| Immigrants | Laos | 0.6 /100 | #265 | Tragic $49,190 |
| Somalis | 0.5 /100 | #266 | Tragic $49,025 |
| Spanish Americans | 0.5 /100 | #267 | Tragic $49,008 |
| Ute | 0.4 /100 | #268 | Tragic $48,899 |
| Tsimshian | 0.4 /100 | #269 | Tragic $48,836 |
| Potawatomi | 0.4 /100 | #270 | Tragic $48,768 |
| Cherokee | 0.3 /100 | #271 | Tragic $48,669 |
| Salvadorans | 0.3 /100 | #272 | Tragic $48,646 |
| Jamaicans | 0.3 /100 | #273 | Tragic $48,632 |
| Colville | 0.3 /100 | #274 | Tragic $48,516 |
| Immigrants | Somalia | 0.3 /100 | #275 | Tragic $48,439 |
Demographics Similar to Houma by Median Male Earnings
In terms of median male earnings, the demographic groups most similar to Houma are Hawaiian ($50,488, a difference of 0.12%), Guyanese ($50,613, a difference of 0.13%), French American Indian ($50,611, a difference of 0.13%), Immigrants from Ecuador ($50,474, a difference of 0.14%), and Immigrants from St. Vincent and the Grenadines ($50,665, a difference of 0.23%).
| Demographics | Rating | Rank | Median Male Earnings |
| Immigrants | Barbados | 2.6 /100 | #237 | Tragic $50,795 |
| Malaysians | 2.5 /100 | #238 | Tragic $50,772 |
| Americans | 2.5 /100 | #239 | Tragic $50,761 |
| West Indians | 2.3 /100 | #240 | Tragic $50,682 |
| Immigrants | St. Vincent and the Grenadines | 2.3 /100 | #241 | Tragic $50,665 |
| Guyanese | 2.2 /100 | #242 | Tragic $50,613 |
| French American Indians | 2.2 /100 | #243 | Tragic $50,611 |
| Houma | 2.0 /100 | #244 | Tragic $50,547 |
| Hawaiians | 1.9 /100 | #245 | Tragic $50,488 |
| Immigrants | Ecuador | 1.9 /100 | #246 | Tragic $50,474 |
| Sub-Saharan Africans | 1.8 /100 | #247 | Tragic $50,408 |
| Immigrants | Guyana | 1.6 /100 | #248 | Tragic $50,321 |
| Immigrants | Burma/Myanmar | 1.6 /100 | #249 | Tragic $50,298 |
| Osage | 1.6 /100 | #250 | Tragic $50,292 |
| Immigrants | Grenada | 1.6 /100 | #251 | Tragic $50,279 |