Tongan vs Austrian Median Female Earnings
COMPARE
Tongan
Austrian
Median Female Earnings
Median Female Earnings Comparison
Tongans
Austrians
$38,288
MEDIAN FEMALE EARNINGS
5.1/ 100
METRIC RATING
233rd/ 347
METRIC RANK
$40,923
MEDIAN FEMALE EARNINGS
92.7/ 100
METRIC RATING
125th/ 347
METRIC RANK
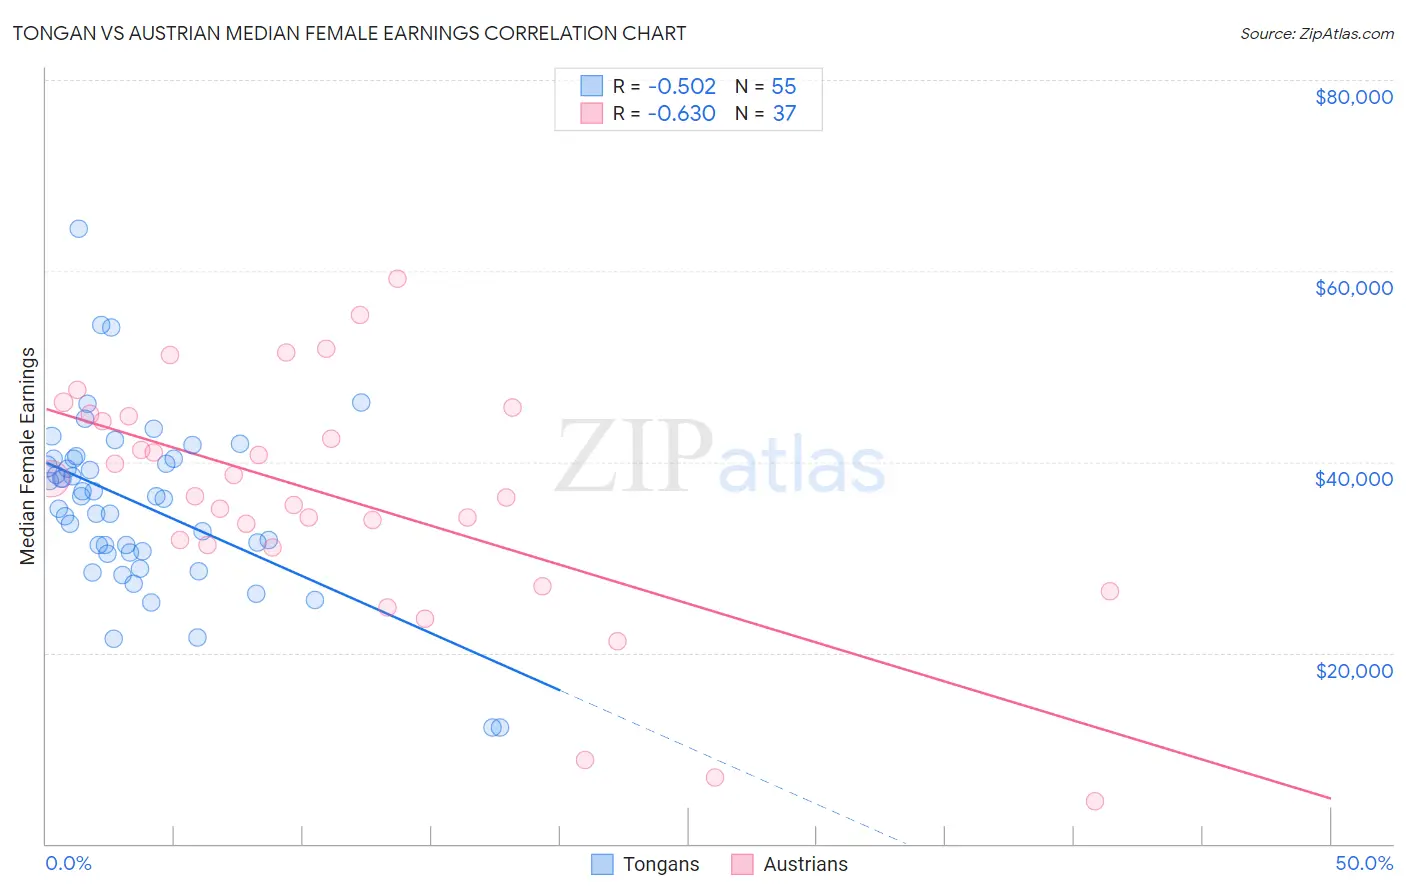
Tongan vs Austrian Median Female Earnings Correlation Chart
The statistical analysis conducted on geographies consisting of 102,899,109 people shows a substantial negative correlation between the proportion of Tongans and median female earnings in the United States with a correlation coefficient (R) of -0.502 and weighted average of $38,288. Similarly, the statistical analysis conducted on geographies consisting of 451,723,547 people shows a significant negative correlation between the proportion of Austrians and median female earnings in the United States with a correlation coefficient (R) of -0.630 and weighted average of $40,923, a difference of 6.9%.
Median Female Earnings Correlation Summary
| Measurement | Tongan | Austrian |
| Minimum | $12,128 | $4,400 |
| Maximum | $64,435 | $59,167 |
| Range | $52,307 | $54,767 |
| Mean | $35,533 | $36,245 |
| Median | $36,346 | $36,406 |
| Interquartile 25% (IQ1) | $30,514 | $31,217 |
| Interquartile 75% (IQ3) | $40,343 | $44,864 |
| Interquartile Range (IQR) | $9,829 | $13,647 |
| Standard Deviation (Sample) | $9,124 | $12,547 |
| Standard Deviation (Population) | $9,040 | $12,376 |
Similar Demographics by Median Female Earnings
Demographics Similar to Tongans by Median Female Earnings
In terms of median female earnings, the demographic groups most similar to Tongans are Celtic ($38,283, a difference of 0.010%), Scandinavian ($38,306, a difference of 0.050%), Somali ($38,333, a difference of 0.12%), Basque ($38,352, a difference of 0.17%), and Sudanese ($38,215, a difference of 0.19%).
| Demographics | Rating | Rank | Median Female Earnings |
| French Canadians | 6.8 /100 | #226 | Tragic $38,436 |
| Scottish | 6.3 /100 | #227 | Tragic $38,397 |
| Sub-Saharan Africans | 6.2 /100 | #228 | Tragic $38,391 |
| Belgians | 6.1 /100 | #229 | Tragic $38,382 |
| Basques | 5.7 /100 | #230 | Tragic $38,352 |
| Somalis | 5.5 /100 | #231 | Tragic $38,333 |
| Scandinavians | 5.2 /100 | #232 | Tragic $38,306 |
| Tongans | 5.1 /100 | #233 | Tragic $38,288 |
| Celtics | 5.0 /100 | #234 | Tragic $38,283 |
| Sudanese | 4.4 /100 | #235 | Tragic $38,215 |
| Liberians | 4.4 /100 | #236 | Tragic $38,215 |
| Immigrants | Cabo Verde | 4.3 /100 | #237 | Tragic $38,208 |
| Alaska Natives | 4.3 /100 | #238 | Tragic $38,202 |
| English | 4.2 /100 | #239 | Tragic $38,196 |
| Finns | 4.0 /100 | #240 | Tragic $38,173 |
Demographics Similar to Austrians by Median Female Earnings
In terms of median female earnings, the demographic groups most similar to Austrians are Immigrants from Trinidad and Tobago ($40,895, a difference of 0.070%), Ugandan ($40,889, a difference of 0.080%), Trinidadian and Tobagonian ($40,958, a difference of 0.090%), Guyanese ($40,973, a difference of 0.12%), and Immigrants from Jordan ($40,977, a difference of 0.13%).
| Demographics | Rating | Rank | Median Female Earnings |
| Immigrants | Lebanon | 95.6 /100 | #118 | Exceptional $41,183 |
| Immigrants | Philippines | 95.0 /100 | #119 | Exceptional $41,114 |
| Immigrants | Kuwait | 94.4 /100 | #120 | Exceptional $41,055 |
| Croatians | 93.7 /100 | #121 | Exceptional $40,993 |
| Immigrants | Jordan | 93.5 /100 | #122 | Exceptional $40,977 |
| Guyanese | 93.4 /100 | #123 | Exceptional $40,973 |
| Trinidadians and Tobagonians | 93.2 /100 | #124 | Exceptional $40,958 |
| Austrians | 92.7 /100 | #125 | Exceptional $40,923 |
| Immigrants | Trinidad and Tobago | 92.3 /100 | #126 | Exceptional $40,895 |
| Ugandans | 92.2 /100 | #127 | Exceptional $40,889 |
| Carpatho Rusyns | 91.2 /100 | #128 | Exceptional $40,825 |
| Zimbabweans | 90.8 /100 | #129 | Exceptional $40,798 |
| Immigrants | Guyana | 90.3 /100 | #130 | Exceptional $40,773 |
| Chileans | 90.0 /100 | #131 | Exceptional $40,757 |
| Immigrants | Uganda | 89.7 /100 | #132 | Excellent $40,739 |