Tlingit-Haida vs Iranian Householder Income Under 25 years
COMPARE
Tlingit-Haida
Iranian
Householder Income Under 25 years
Householder Income Under 25 years Comparison
Tlingit-Haida
Iranians
$55,914
HOUSEHOLDER INCOME UNDER 25 YEARS
100.0/ 100
METRIC RATING
35th/ 347
METRIC RANK
$55,548
HOUSEHOLDER INCOME UNDER 25 YEARS
100.0/ 100
METRIC RATING
49th/ 347
METRIC RANK
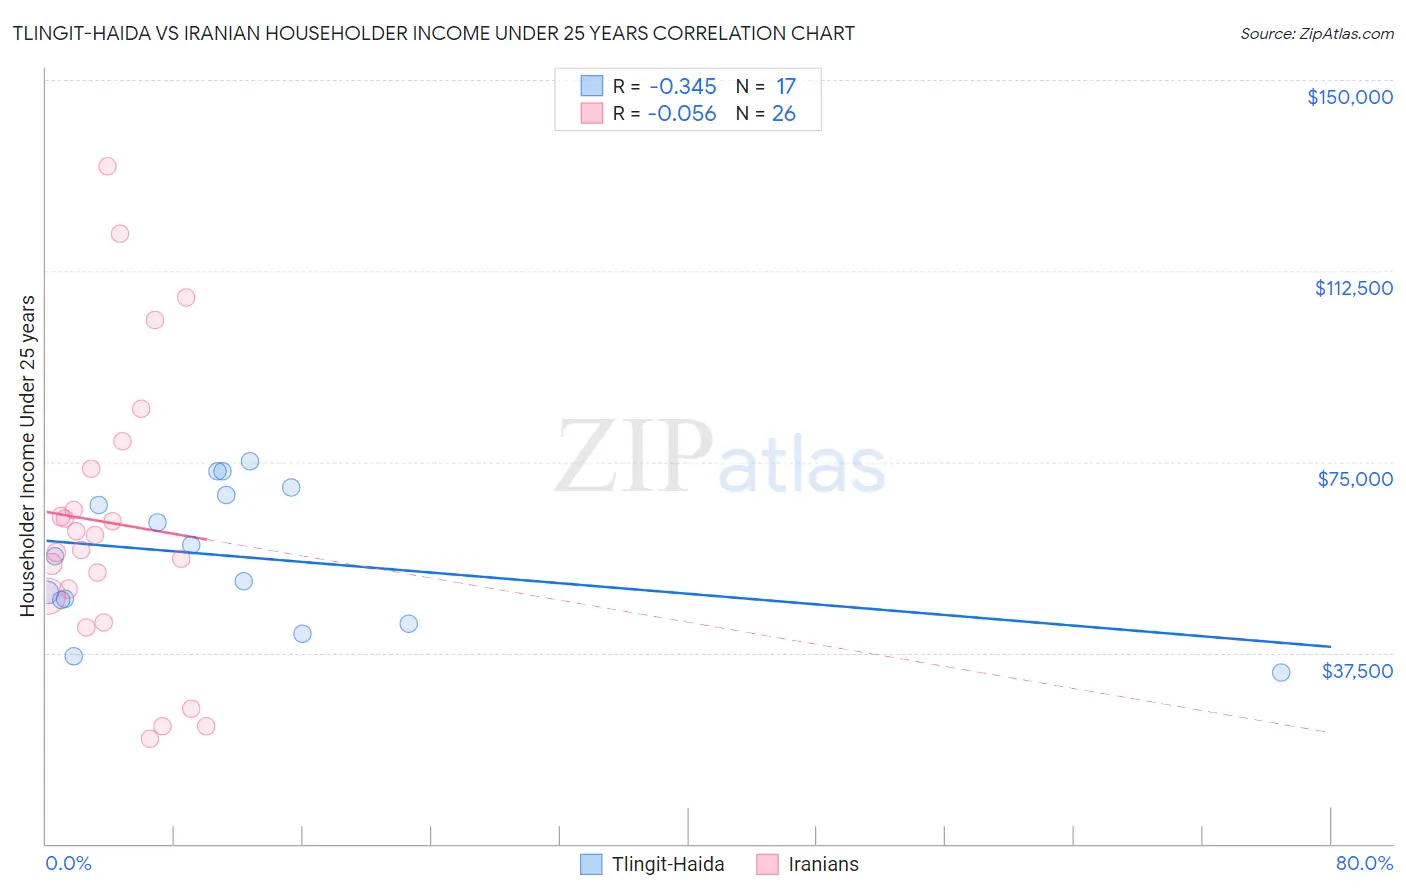
Tlingit-Haida vs Iranian Householder Income Under 25 years Correlation Chart
The statistical analysis conducted on geographies consisting of 57,369,671 people shows a mild negative correlation between the proportion of Tlingit-Haida and household income with householder under the age of 25 in the United States with a correlation coefficient (R) of -0.345 and weighted average of $55,914. Similarly, the statistical analysis conducted on geographies consisting of 273,572,595 people shows a slight negative correlation between the proportion of Iranians and household income with householder under the age of 25 in the United States with a correlation coefficient (R) of -0.056 and weighted average of $55,548, a difference of 0.66%.
Householder Income Under 25 years Correlation Summary
| Measurement | Tlingit-Haida | Iranian |
| Minimum | $33,750 | $20,584 |
| Maximum | $75,104 | $133,071 |
| Range | $41,354 | $112,487 |
| Mean | $56,260 | $62,988 |
| Median | $56,462 | $59,129 |
| Interquartile 25% (IQ1) | $45,554 | $48,552 |
| Interquartile 75% (IQ3) | $69,196 | $73,761 |
| Interquartile Range (IQR) | $23,642 | $25,209 |
| Standard Deviation (Sample) | $13,469 | $28,528 |
| Standard Deviation (Population) | $13,067 | $27,974 |
Demographics Similar to Tlingit-Haida and Iranians by Householder Income Under 25 years
In terms of householder income under 25 years, the demographic groups most similar to Tlingit-Haida are Immigrants from Israel ($55,913, a difference of 0.0%), Immigrants from Japan ($55,932, a difference of 0.030%), Inupiat ($55,935, a difference of 0.040%), Immigrants from Russia ($55,891, a difference of 0.040%), and Immigrants from Iran ($55,880, a difference of 0.060%). Similarly, the demographic groups most similar to Iranians are Puget Sound Salish ($55,543, a difference of 0.010%), Immigrants from Vietnam ($55,562, a difference of 0.030%), Spanish American Indian ($55,573, a difference of 0.040%), Immigrants from Eastern Europe ($55,572, a difference of 0.040%), and Cambodian ($55,571, a difference of 0.040%).
| Demographics | Rating | Rank | Householder Income Under 25 years |
| Peruvians | 100.0 /100 | #32 | Exceptional $56,052 |
| Inupiat | 100.0 /100 | #33 | Exceptional $55,935 |
| Immigrants | Japan | 100.0 /100 | #34 | Exceptional $55,932 |
| Tlingit-Haida | 100.0 /100 | #35 | Exceptional $55,914 |
| Immigrants | Israel | 100.0 /100 | #36 | Exceptional $55,913 |
| Immigrants | Russia | 100.0 /100 | #37 | Exceptional $55,891 |
| Immigrants | Iran | 100.0 /100 | #38 | Exceptional $55,880 |
| Immigrants | Belarus | 100.0 /100 | #39 | Exceptional $55,743 |
| Immigrants | Greece | 100.0 /100 | #40 | Exceptional $55,727 |
| Immigrants | Guyana | 100.0 /100 | #41 | Exceptional $55,726 |
| Immigrants | Korea | 100.0 /100 | #42 | Exceptional $55,716 |
| Immigrants | South Eastern Asia | 100.0 /100 | #43 | Exceptional $55,714 |
| Paraguayans | 100.0 /100 | #44 | Exceptional $55,614 |
| Spanish American Indians | 100.0 /100 | #45 | Exceptional $55,573 |
| Immigrants | Eastern Europe | 100.0 /100 | #46 | Exceptional $55,572 |
| Cambodians | 100.0 /100 | #47 | Exceptional $55,571 |
| Immigrants | Vietnam | 100.0 /100 | #48 | Exceptional $55,562 |
| Iranians | 100.0 /100 | #49 | Exceptional $55,548 |
| Puget Sound Salish | 100.0 /100 | #50 | Exceptional $55,543 |
| Immigrants | Romania | 100.0 /100 | #51 | Exceptional $55,522 |
| Immigrants | Indonesia | 100.0 /100 | #52 | Exceptional $55,521 |