Tlingit-Haida vs Immigrants from Norway Median Female Earnings
COMPARE
Tlingit-Haida
Immigrants from Norway
Median Female Earnings
Median Female Earnings Comparison
Tlingit-Haida
Immigrants from Norway
$39,513
MEDIAN FEMALE EARNINGS
40.5/ 100
METRIC RATING
182nd/ 347
METRIC RANK
$42,837
MEDIAN FEMALE EARNINGS
99.9/ 100
METRIC RATING
66th/ 347
METRIC RANK
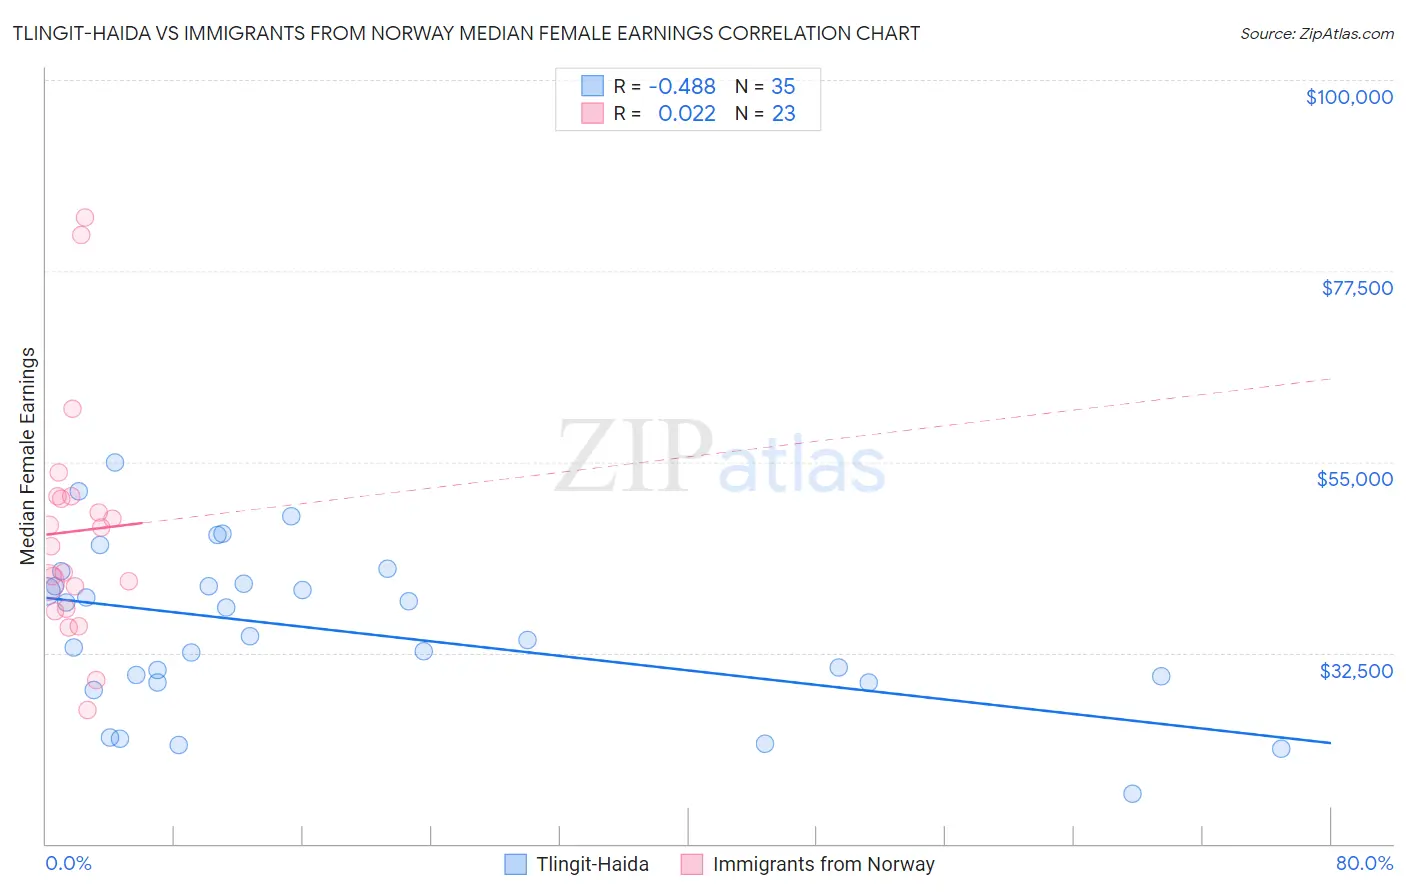
Tlingit-Haida vs Immigrants from Norway Median Female Earnings Correlation Chart
The statistical analysis conducted on geographies consisting of 60,850,593 people shows a moderate negative correlation between the proportion of Tlingit-Haida and median female earnings in the United States with a correlation coefficient (R) of -0.488 and weighted average of $39,513. Similarly, the statistical analysis conducted on geographies consisting of 116,697,364 people shows no correlation between the proportion of Immigrants from Norway and median female earnings in the United States with a correlation coefficient (R) of 0.022 and weighted average of $42,837, a difference of 8.4%.
Median Female Earnings Correlation Summary
| Measurement | Tlingit-Haida | Immigrants from Norway |
| Minimum | $15,833 | $25,783 |
| Maximum | $55,000 | $83,727 |
| Range | $39,167 | $57,944 |
| Mean | $35,190 | $46,834 |
| Median | $34,397 | $44,998 |
| Interquartile 25% (IQ1) | $28,977 | $37,628 |
| Interquartile 75% (IQ3) | $40,590 | $50,939 |
| Interquartile Range (IQR) | $11,613 | $13,311 |
| Standard Deviation (Sample) | $9,336 | $13,874 |
| Standard Deviation (Population) | $9,202 | $13,569 |
Similar Demographics by Median Female Earnings
Demographics Similar to Tlingit-Haida by Median Female Earnings
In terms of median female earnings, the demographic groups most similar to Tlingit-Haida are Hungarian ($39,510, a difference of 0.010%), Tsimshian ($39,530, a difference of 0.050%), Immigrants from Kenya ($39,535, a difference of 0.060%), European ($39,457, a difference of 0.14%), and Immigrants from West Indies ($39,441, a difference of 0.18%).
| Demographics | Rating | Rank | Median Female Earnings |
| Immigrants | South America | 47.2 /100 | #175 | Average $39,643 |
| Nigerians | 47.0 /100 | #176 | Average $39,641 |
| Costa Ricans | 46.1 /100 | #177 | Average $39,622 |
| Slavs | 45.6 /100 | #178 | Average $39,613 |
| Immigrants | Germany | 45.1 /100 | #179 | Average $39,603 |
| Immigrants | Kenya | 41.6 /100 | #180 | Average $39,535 |
| Tsimshian | 41.4 /100 | #181 | Average $39,530 |
| Tlingit-Haida | 40.5 /100 | #182 | Average $39,513 |
| Hungarians | 40.3 /100 | #183 | Average $39,510 |
| Europeans | 37.7 /100 | #184 | Fair $39,457 |
| Immigrants | West Indies | 36.9 /100 | #185 | Fair $39,441 |
| Colombians | 36.9 /100 | #186 | Fair $39,439 |
| Swedes | 36.0 /100 | #187 | Fair $39,421 |
| Bermudans | 35.9 /100 | #188 | Fair $39,418 |
| Senegalese | 34.2 /100 | #189 | Fair $39,384 |
Demographics Similar to Immigrants from Norway by Median Female Earnings
In terms of median female earnings, the demographic groups most similar to Immigrants from Norway are Immigrants from Egypt ($42,837, a difference of 0.0%), Immigrants from Austria ($42,824, a difference of 0.030%), Immigrants from Spain ($42,815, a difference of 0.050%), Sierra Leonean ($42,868, a difference of 0.070%), and Immigrants from Ethiopia ($42,744, a difference of 0.22%).
| Demographics | Rating | Rank | Median Female Earnings |
| Estonians | 99.9 /100 | #59 | Exceptional $43,106 |
| Immigrants | Latvia | 99.9 /100 | #60 | Exceptional $43,099 |
| Immigrants | Bulgaria | 99.9 /100 | #61 | Exceptional $43,085 |
| Afghans | 99.9 /100 | #62 | Exceptional $43,077 |
| Immigrants | Ukraine | 99.9 /100 | #63 | Exceptional $43,069 |
| Immigrants | Pakistan | 99.9 /100 | #64 | Exceptional $43,052 |
| Sierra Leoneans | 99.9 /100 | #65 | Exceptional $42,868 |
| Immigrants | Norway | 99.9 /100 | #66 | Exceptional $42,837 |
| Immigrants | Egypt | 99.9 /100 | #67 | Exceptional $42,837 |
| Immigrants | Austria | 99.8 /100 | #68 | Exceptional $42,824 |
| Immigrants | Spain | 99.8 /100 | #69 | Exceptional $42,815 |
| Immigrants | Ethiopia | 99.8 /100 | #70 | Exceptional $42,744 |
| Immigrants | Romania | 99.8 /100 | #71 | Exceptional $42,718 |
| Albanians | 99.8 /100 | #72 | Exceptional $42,584 |
| Mongolians | 99.7 /100 | #73 | Exceptional $42,542 |