Thai vs British West Indian Householder Income Under 25 years
COMPARE
Thai
British West Indian
Householder Income Under 25 years
Householder Income Under 25 years Comparison
Thais
British West Indians
$59,187
HOUSEHOLDER INCOME UNDER 25 YEARS
100.0/ 100
METRIC RATING
6th/ 347
METRIC RANK
$51,844
HOUSEHOLDER INCOME UNDER 25 YEARS
30.0/ 100
METRIC RATING
177th/ 347
METRIC RANK
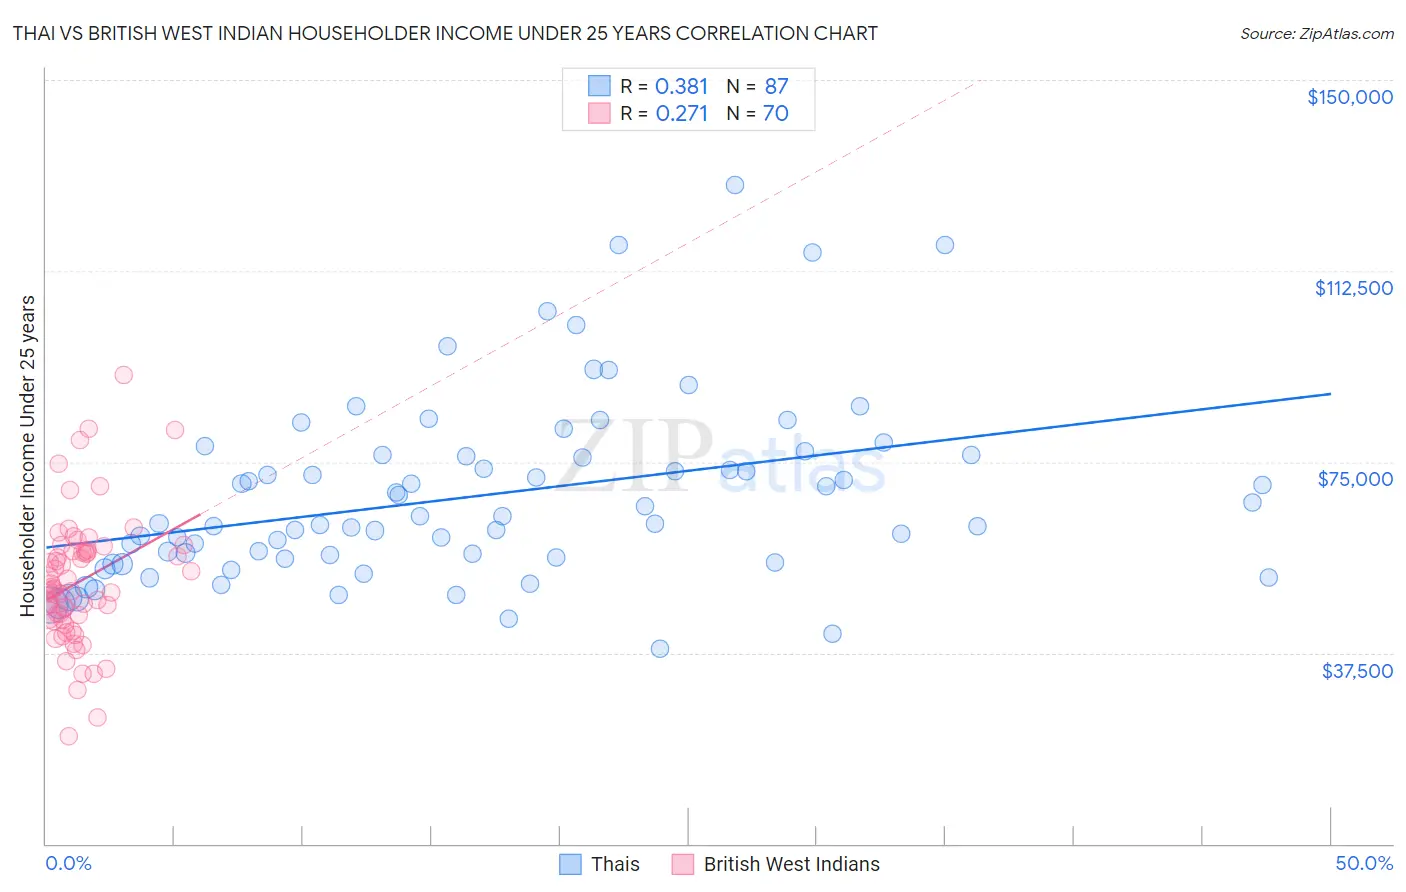
Thai vs British West Indian Householder Income Under 25 years Correlation Chart
The statistical analysis conducted on geographies consisting of 390,520,827 people shows a mild positive correlation between the proportion of Thais and household income with householder under the age of 25 in the United States with a correlation coefficient (R) of 0.381 and weighted average of $59,187. Similarly, the statistical analysis conducted on geographies consisting of 137,149,594 people shows a weak positive correlation between the proportion of British West Indians and household income with householder under the age of 25 in the United States with a correlation coefficient (R) of 0.271 and weighted average of $51,844, a difference of 14.2%.
Householder Income Under 25 years Correlation Summary
| Measurement | Thai | British West Indian |
| Minimum | $38,359 | $21,210 |
| Maximum | $129,301 | $92,155 |
| Range | $90,942 | $70,945 |
| Mean | $68,286 | $51,462 |
| Median | $62,959 | $49,982 |
| Interquartile 25% (IQ1) | $56,029 | $43,850 |
| Interquartile 75% (IQ3) | $76,245 | $57,401 |
| Interquartile Range (IQR) | $20,216 | $13,551 |
| Standard Deviation (Sample) | $17,960 | $12,774 |
| Standard Deviation (Population) | $17,857 | $12,683 |
Similar Demographics by Householder Income Under 25 years
Demographics Similar to Thais by Householder Income Under 25 years
In terms of householder income under 25 years, the demographic groups most similar to Thais are Immigrants from Bolivia ($59,389, a difference of 0.34%), Immigrants from Taiwan ($59,424, a difference of 0.40%), Bolivian ($58,506, a difference of 1.2%), Immigrants from India ($59,914, a difference of 1.2%), and Indian (Asian) ($58,239, a difference of 1.6%).
| Demographics | Rating | Rank | Householder Income Under 25 years |
| Assyrians/Chaldeans/Syriacs | 100.0 /100 | #1 | Exceptional $65,329 |
| Immigrants | Hong Kong | 100.0 /100 | #2 | Exceptional $62,083 |
| Immigrants | India | 100.0 /100 | #3 | Exceptional $59,914 |
| Immigrants | Taiwan | 100.0 /100 | #4 | Exceptional $59,424 |
| Immigrants | Bolivia | 100.0 /100 | #5 | Exceptional $59,389 |
| Thais | 100.0 /100 | #6 | Exceptional $59,187 |
| Bolivians | 100.0 /100 | #7 | Exceptional $58,506 |
| Indians (Asian) | 100.0 /100 | #8 | Exceptional $58,239 |
| Chinese | 100.0 /100 | #9 | Exceptional $58,162 |
| Afghans | 100.0 /100 | #10 | Exceptional $58,019 |
| Immigrants | China | 100.0 /100 | #11 | Exceptional $57,931 |
| Immigrants | Philippines | 100.0 /100 | #12 | Exceptional $57,930 |
| Immigrants | South Central Asia | 100.0 /100 | #13 | Exceptional $57,818 |
| Filipinos | 100.0 /100 | #14 | Exceptional $57,740 |
| Koreans | 100.0 /100 | #15 | Exceptional $57,730 |
Demographics Similar to British West Indians by Householder Income Under 25 years
In terms of householder income under 25 years, the demographic groups most similar to British West Indians are Finnish ($51,827, a difference of 0.030%), Basque ($51,818, a difference of 0.050%), Immigrants from England ($51,817, a difference of 0.050%), European ($51,796, a difference of 0.090%), and Jordanian ($51,796, a difference of 0.090%).
| Demographics | Rating | Rank | Householder Income Under 25 years |
| Israelis | 58.8 /100 | #170 | Average $52,335 |
| Immigrants | Uruguay | 56.8 /100 | #171 | Average $52,302 |
| Cypriots | 51.2 /100 | #172 | Average $52,209 |
| Barbadians | 50.8 /100 | #173 | Average $52,202 |
| Immigrants | Western Asia | 50.0 /100 | #174 | Average $52,190 |
| Immigrants | Zimbabwe | 33.8 /100 | #175 | Fair $51,914 |
| Austrians | 32.9 /100 | #176 | Fair $51,898 |
| British West Indians | 30.0 /100 | #177 | Fair $51,844 |
| Finns | 29.2 /100 | #178 | Fair $51,827 |
| Basques | 28.7 /100 | #179 | Fair $51,818 |
| Immigrants | England | 28.7 /100 | #180 | Fair $51,817 |
| Europeans | 27.6 /100 | #181 | Fair $51,796 |
| Jordanians | 27.6 /100 | #182 | Fair $51,796 |
| Mexican American Indians | 27.0 /100 | #183 | Fair $51,783 |
| Paiute | 25.1 /100 | #184 | Fair $51,743 |