Syrian vs Immigrants from Indonesia Median Male Earnings
COMPARE
Syrian
Immigrants from Indonesia
Median Male Earnings
Median Male Earnings Comparison
Syrians
Immigrants from Indonesia
$58,187
MEDIAN MALE EARNINGS
97.4/ 100
METRIC RATING
102nd/ 347
METRIC RANK
$60,935
MEDIAN MALE EARNINGS
99.8/ 100
METRIC RATING
65th/ 347
METRIC RANK
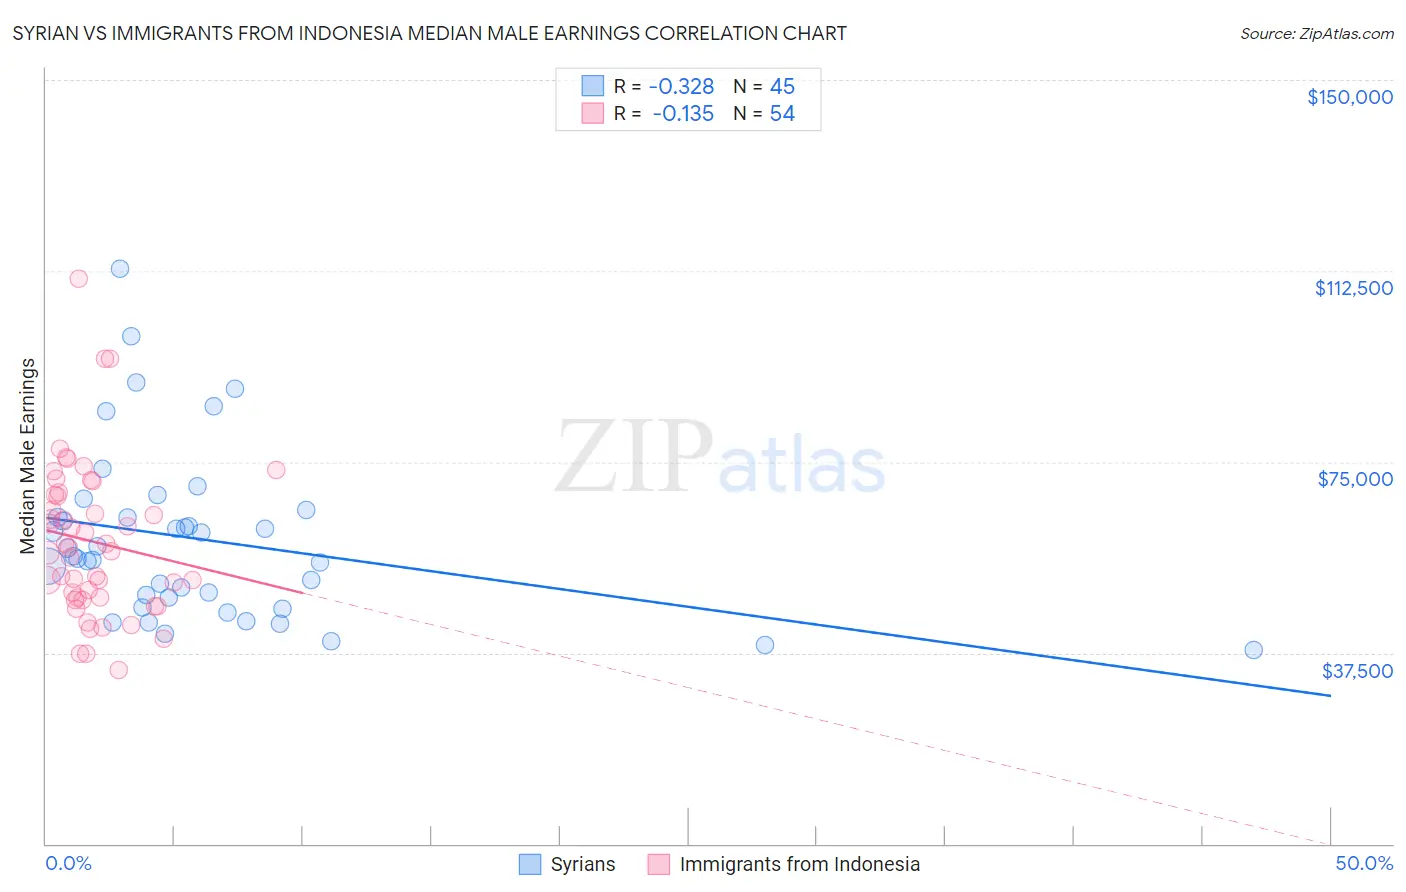
Syrian vs Immigrants from Indonesia Median Male Earnings Correlation Chart
The statistical analysis conducted on geographies consisting of 266,273,099 people shows a mild negative correlation between the proportion of Syrians and median male earnings in the United States with a correlation coefficient (R) of -0.328 and weighted average of $58,187. Similarly, the statistical analysis conducted on geographies consisting of 215,756,061 people shows a poor negative correlation between the proportion of Immigrants from Indonesia and median male earnings in the United States with a correlation coefficient (R) of -0.135 and weighted average of $60,935, a difference of 4.7%.
Median Male Earnings Correlation Summary
| Measurement | Syrian | Immigrants from Indonesia |
| Minimum | $38,125 | $34,072 |
| Maximum | $112,858 | $111,048 |
| Range | $74,733 | $76,976 |
| Mean | $59,779 | $59,341 |
| Median | $56,452 | $57,826 |
| Interquartile 25% (IQ1) | $47,297 | $48,312 |
| Interquartile 75% (IQ3) | $64,910 | $68,539 |
| Interquartile Range (IQR) | $17,614 | $20,227 |
| Standard Deviation (Sample) | $16,573 | $15,206 |
| Standard Deviation (Population) | $16,388 | $15,065 |
Similar Demographics by Median Male Earnings
Demographics Similar to Syrians by Median Male Earnings
In terms of median male earnings, the demographic groups most similar to Syrians are Polish ($58,139, a difference of 0.080%), Armenian ($58,134, a difference of 0.090%), Immigrants from Western Asia ($58,131, a difference of 0.10%), Immigrants from Brazil ($58,324, a difference of 0.24%), and Immigrants from Northern Africa ($58,008, a difference of 0.31%).
| Demographics | Rating | Rank | Median Male Earnings |
| Immigrants | Lebanon | 98.6 /100 | #95 | Exceptional $58,835 |
| Albanians | 98.4 /100 | #96 | Exceptional $58,680 |
| Northern Europeans | 98.2 /100 | #97 | Exceptional $58,588 |
| Jordanians | 98.1 /100 | #98 | Exceptional $58,500 |
| Immigrants | Poland | 98.0 /100 | #99 | Exceptional $58,452 |
| Assyrians/Chaldeans/Syriacs | 97.9 /100 | #100 | Exceptional $58,437 |
| Immigrants | Brazil | 97.7 /100 | #101 | Exceptional $58,324 |
| Syrians | 97.4 /100 | #102 | Exceptional $58,187 |
| Poles | 97.3 /100 | #103 | Exceptional $58,139 |
| Armenians | 97.3 /100 | #104 | Exceptional $58,134 |
| Immigrants | Western Asia | 97.3 /100 | #105 | Exceptional $58,131 |
| Immigrants | Northern Africa | 96.9 /100 | #106 | Exceptional $58,008 |
| Serbians | 96.8 /100 | #107 | Exceptional $57,975 |
| Immigrants | Uzbekistan | 96.7 /100 | #108 | Exceptional $57,941 |
| British | 96.5 /100 | #109 | Exceptional $57,890 |
Demographics Similar to Immigrants from Indonesia by Median Male Earnings
In terms of median male earnings, the demographic groups most similar to Immigrants from Indonesia are Immigrants from Croatia ($60,914, a difference of 0.030%), Immigrants from Eastern Europe ($60,958, a difference of 0.040%), Immigrants from Pakistan ($60,987, a difference of 0.080%), Immigrants from Romania ($61,040, a difference of 0.17%), and Bolivian ($61,066, a difference of 0.21%).
| Demographics | Rating | Rank | Median Male Earnings |
| New Zealanders | 99.9 /100 | #58 | Exceptional $61,199 |
| Immigrants | Netherlands | 99.8 /100 | #59 | Exceptional $61,096 |
| Egyptians | 99.8 /100 | #60 | Exceptional $61,095 |
| Bolivians | 99.8 /100 | #61 | Exceptional $61,066 |
| Immigrants | Romania | 99.8 /100 | #62 | Exceptional $61,040 |
| Immigrants | Pakistan | 99.8 /100 | #63 | Exceptional $60,987 |
| Immigrants | Eastern Europe | 99.8 /100 | #64 | Exceptional $60,958 |
| Immigrants | Indonesia | 99.8 /100 | #65 | Exceptional $60,935 |
| Immigrants | Croatia | 99.8 /100 | #66 | Exceptional $60,914 |
| Immigrants | Spain | 99.8 /100 | #67 | Exceptional $60,750 |
| Immigrants | Serbia | 99.7 /100 | #68 | Exceptional $60,600 |
| Immigrants | Canada | 99.7 /100 | #69 | Exceptional $60,388 |
| Immigrants | Bulgaria | 99.7 /100 | #70 | Exceptional $60,358 |
| Mongolians | 99.7 /100 | #71 | Exceptional $60,350 |
| Immigrants | Western Europe | 99.7 /100 | #72 | Exceptional $60,334 |