Swiss vs Sioux Median Male Earnings
COMPARE
Swiss
Sioux
Median Male Earnings
Median Male Earnings Comparison
Swiss
Sioux
$55,731
MEDIAN MALE EARNINGS
77.1/ 100
METRIC RATING
150th/ 347
METRIC RANK
$45,566
MEDIAN MALE EARNINGS
0.0/ 100
METRIC RATING
322nd/ 347
METRIC RANK
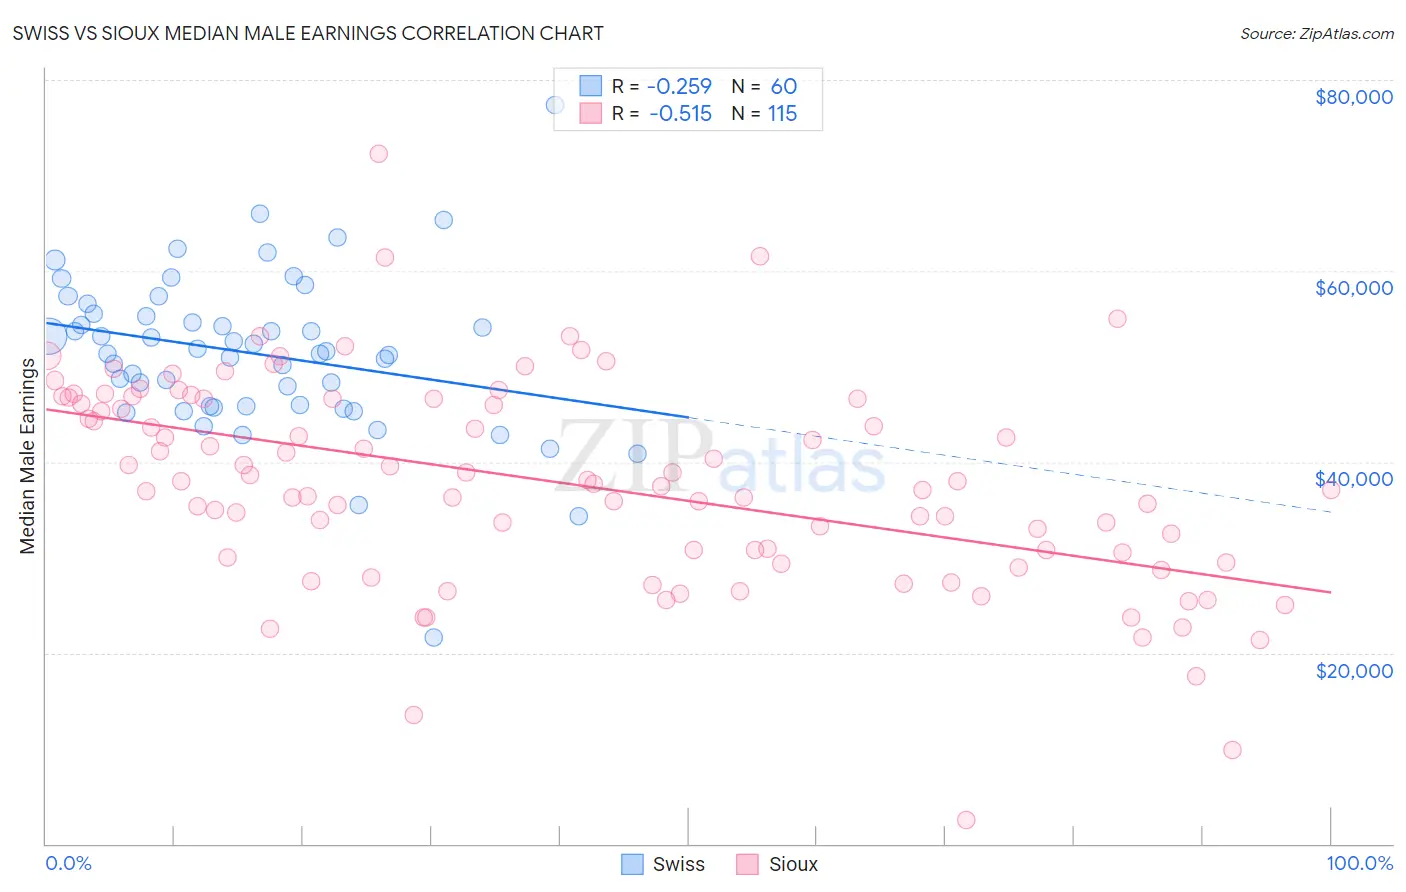
Swiss vs Sioux Median Male Earnings Correlation Chart
The statistical analysis conducted on geographies consisting of 464,659,146 people shows a weak negative correlation between the proportion of Swiss and median male earnings in the United States with a correlation coefficient (R) of -0.259 and weighted average of $55,731. Similarly, the statistical analysis conducted on geographies consisting of 234,123,806 people shows a substantial negative correlation between the proportion of Sioux and median male earnings in the United States with a correlation coefficient (R) of -0.515 and weighted average of $45,566, a difference of 22.3%.
Median Male Earnings Correlation Summary
| Measurement | Swiss | Sioux |
| Minimum | $21,563 | $2,499 |
| Maximum | $77,386 | $72,273 |
| Range | $55,823 | $69,774 |
| Mean | $51,336 | $37,765 |
| Median | $51,444 | $37,671 |
| Interquartile 25% (IQ1) | $45,855 | $29,938 |
| Interquartile 75% (IQ3) | $55,388 | $46,607 |
| Interquartile Range (IQR) | $9,533 | $16,669 |
| Standard Deviation (Sample) | $8,461 | $10,941 |
| Standard Deviation (Population) | $8,390 | $10,893 |
Similar Demographics by Median Male Earnings
Demographics Similar to Swiss by Median Male Earnings
In terms of median male earnings, the demographic groups most similar to Swiss are English ($55,747, a difference of 0.030%), Immigrants from Oceania ($55,712, a difference of 0.030%), Scottish ($55,793, a difference of 0.11%), Peruvian ($55,659, a difference of 0.13%), and Immigrants from Philippines ($55,809, a difference of 0.14%).
| Demographics | Rating | Rank | Median Male Earnings |
| Sri Lankans | 83.4 /100 | #143 | Excellent $56,136 |
| Immigrants | Uganda | 82.4 /100 | #144 | Excellent $56,064 |
| Norwegians | 80.9 /100 | #145 | Excellent $55,965 |
| Immigrants | Chile | 80.7 /100 | #146 | Excellent $55,954 |
| Immigrants | Philippines | 78.4 /100 | #147 | Good $55,809 |
| Scottish | 78.2 /100 | #148 | Good $55,793 |
| English | 77.4 /100 | #149 | Good $55,747 |
| Swiss | 77.1 /100 | #150 | Good $55,731 |
| Immigrants | Oceania | 76.8 /100 | #151 | Good $55,712 |
| Peruvians | 75.8 /100 | #152 | Good $55,659 |
| Immigrants | Nepal | 75.0 /100 | #153 | Good $55,615 |
| Taiwanese | 73.9 /100 | #154 | Good $55,556 |
| Scandinavians | 73.4 /100 | #155 | Good $55,527 |
| Immigrants | Ethiopia | 71.6 /100 | #156 | Good $55,434 |
| Icelanders | 71.2 /100 | #157 | Good $55,415 |
Demographics Similar to Sioux by Median Male Earnings
In terms of median male earnings, the demographic groups most similar to Sioux are Immigrants from Central America ($45,538, a difference of 0.060%), Fijian ($45,607, a difference of 0.090%), Black/African American ($45,523, a difference of 0.090%), Yuman ($45,446, a difference of 0.26%), and Immigrants from Honduras ($45,787, a difference of 0.48%).
| Demographics | Rating | Rank | Median Male Earnings |
| Immigrants | Guatemala | 0.0 /100 | #315 | Tragic $46,244 |
| Immigrants | Caribbean | 0.0 /100 | #316 | Tragic $46,193 |
| Mexicans | 0.0 /100 | #317 | Tragic $46,147 |
| Cheyenne | 0.0 /100 | #318 | Tragic $46,062 |
| Haitians | 0.0 /100 | #319 | Tragic $45,903 |
| Immigrants | Honduras | 0.0 /100 | #320 | Tragic $45,787 |
| Fijians | 0.0 /100 | #321 | Tragic $45,607 |
| Sioux | 0.0 /100 | #322 | Tragic $45,566 |
| Immigrants | Central America | 0.0 /100 | #323 | Tragic $45,538 |
| Blacks/African Americans | 0.0 /100 | #324 | Tragic $45,523 |
| Yuman | 0.0 /100 | #325 | Tragic $45,446 |
| Immigrants | Haiti | 0.0 /100 | #326 | Tragic $45,266 |
| Immigrants | Bahamas | 0.0 /100 | #327 | Tragic $45,176 |
| Kiowa | 0.0 /100 | #328 | Tragic $45,094 |
| Yakama | 0.0 /100 | #329 | Tragic $45,002 |