Sudanese vs Immigrants from West Indies Householder Income Ages 25 - 44 years
COMPARE
Sudanese
Immigrants from West Indies
Householder Income Ages 25 - 44 years
Householder Income Ages 25 - 44 years Comparison
Sudanese
Immigrants from West Indies
$84,401
HOUSEHOLDER INCOME AGES 25 - 44 YEARS
0.4/ 100
METRIC RATING
265th/ 347
METRIC RANK
$87,063
HOUSEHOLDER INCOME AGES 25 - 44 YEARS
1.5/ 100
METRIC RATING
243rd/ 347
METRIC RANK
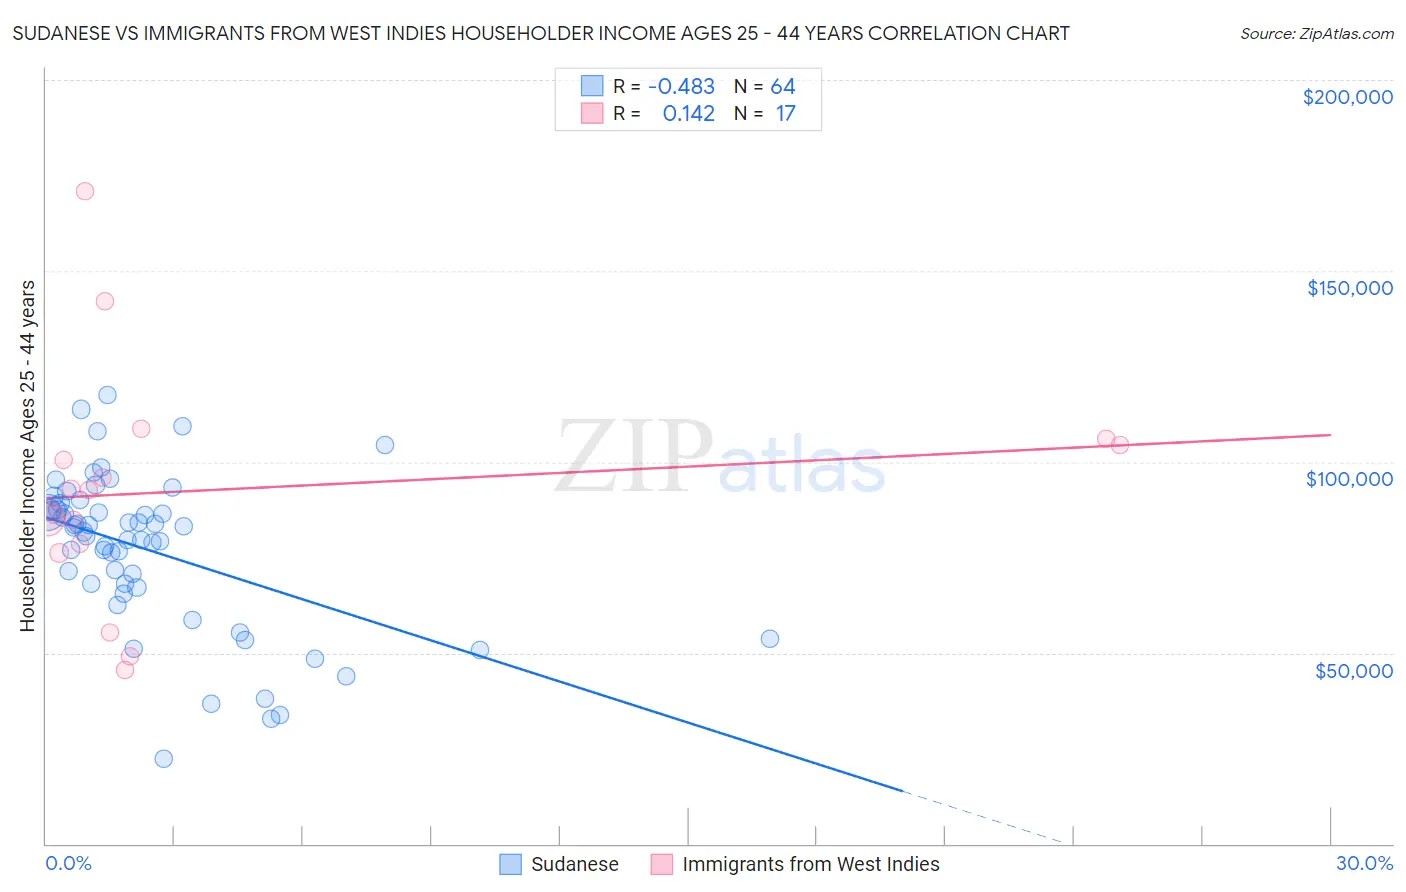
Sudanese vs Immigrants from West Indies Householder Income Ages 25 - 44 years Correlation Chart
The statistical analysis conducted on geographies consisting of 110,044,809 people shows a moderate negative correlation between the proportion of Sudanese and household income with householder between the ages 25 and 44 in the United States with a correlation coefficient (R) of -0.483 and weighted average of $84,401. Similarly, the statistical analysis conducted on geographies consisting of 72,445,724 people shows a poor positive correlation between the proportion of Immigrants from West Indies and household income with householder between the ages 25 and 44 in the United States with a correlation coefficient (R) of 0.142 and weighted average of $87,063, a difference of 3.2%.
Householder Income Ages 25 - 44 years Correlation Summary
| Measurement | Sudanese | Immigrants from West Indies |
| Minimum | $22,303 | $45,500 |
| Maximum | $117,632 | $170,707 |
| Range | $95,330 | $125,207 |
| Mean | $76,942 | $92,620 |
| Median | $82,204 | $92,679 |
| Interquartile 25% (IQ1) | $67,535 | $77,312 |
| Interquartile 75% (IQ3) | $87,340 | $105,207 |
| Interquartile Range (IQR) | $19,805 | $27,895 |
| Standard Deviation (Sample) | $20,185 | $30,962 |
| Standard Deviation (Population) | $20,027 | $30,037 |
Similar Demographics by Householder Income Ages 25 - 44 years
Demographics Similar to Sudanese by Householder Income Ages 25 - 44 years
In terms of householder income ages 25 - 44 years, the demographic groups most similar to Sudanese are Osage ($84,461, a difference of 0.070%), Immigrants from Cabo Verde ($84,304, a difference of 0.12%), Belizean ($84,534, a difference of 0.16%), Hmong ($84,258, a difference of 0.17%), and Cree ($84,574, a difference of 0.20%).
| Demographics | Rating | Rank | Householder Income Ages 25 - 44 years |
| Immigrants | Nicaragua | 0.5 /100 | #258 | Tragic $84,914 |
| Immigrants | Senegal | 0.5 /100 | #259 | Tragic $84,848 |
| Americans | 0.4 /100 | #260 | Tragic $84,791 |
| Inupiat | 0.4 /100 | #261 | Tragic $84,619 |
| Cree | 0.4 /100 | #262 | Tragic $84,574 |
| Belizeans | 0.4 /100 | #263 | Tragic $84,534 |
| Osage | 0.4 /100 | #264 | Tragic $84,461 |
| Sudanese | 0.4 /100 | #265 | Tragic $84,401 |
| Immigrants | Cabo Verde | 0.3 /100 | #266 | Tragic $84,304 |
| Hmong | 0.3 /100 | #267 | Tragic $84,258 |
| Sub-Saharan Africans | 0.3 /100 | #268 | Tragic $84,235 |
| Spanish American Indians | 0.3 /100 | #269 | Tragic $84,085 |
| Jamaicans | 0.3 /100 | #270 | Tragic $83,933 |
| Somalis | 0.2 /100 | #271 | Tragic $83,752 |
| Spanish Americans | 0.2 /100 | #272 | Tragic $83,722 |
Demographics Similar to Immigrants from West Indies by Householder Income Ages 25 - 44 years
In terms of householder income ages 25 - 44 years, the demographic groups most similar to Immigrants from West Indies are Immigrants from Venezuela ($87,038, a difference of 0.030%), West Indian ($87,205, a difference of 0.16%), Immigrants from El Salvador ($86,913, a difference of 0.17%), Immigrants from Burma/Myanmar ($86,736, a difference of 0.38%), and Immigrants from Nigeria ($86,589, a difference of 0.55%).
| Demographics | Rating | Rank | Householder Income Ages 25 - 44 years |
| Immigrants | Cameroon | 2.9 /100 | #236 | Tragic $88,214 |
| Salvadorans | 2.8 /100 | #237 | Tragic $88,198 |
| Alaska Natives | 2.6 /100 | #238 | Tragic $88,018 |
| Immigrants | Ghana | 2.2 /100 | #239 | Tragic $87,760 |
| Nicaraguans | 2.2 /100 | #240 | Tragic $87,751 |
| Nigerians | 2.2 /100 | #241 | Tragic $87,730 |
| West Indians | 1.7 /100 | #242 | Tragic $87,205 |
| Immigrants | West Indies | 1.5 /100 | #243 | Tragic $87,063 |
| Immigrants | Venezuela | 1.5 /100 | #244 | Tragic $87,038 |
| Immigrants | El Salvador | 1.4 /100 | #245 | Tragic $86,913 |
| Immigrants | Burma/Myanmar | 1.3 /100 | #246 | Tragic $86,736 |
| Immigrants | Nigeria | 1.2 /100 | #247 | Tragic $86,589 |
| Immigrants | Sudan | 0.9 /100 | #248 | Tragic $86,109 |
| French American Indians | 0.8 /100 | #249 | Tragic $85,899 |
| Pennsylvania Germans | 0.8 /100 | #250 | Tragic $85,836 |