Subsaharan African vs Immigrants from Bahamas Householder Income Ages 45 - 64 years

COMPARE

Subsaharan African
Race
Ancestry
AfghanAfricanAlaska NativeAlaskan AthabascanAlbanianAleutAlsatianAmericanApacheArabArapahoArgentineanArmenianAssyrian/Chaldean/SyriacAustralianAustrianBahamianBangladeshiBarbadianBasqueBelgianBelizeanBermudanBhutaneseBlackfeetBolivianBrazilianBritishBritish West IndianBulgarianBurmeseCajunCambodianCanadianCape VerdeanCarpatho RusynCelticCentral AmericanCentral American IndianCherokeeCheyenneChickasawChileanChineseChippewaChoctawColombianColvilleComancheCosta RicanCreeCreekCroatianCrowCubanCypriotCzechCzechoslovakianDanishDelawareDominicanDutchDutch West IndianEastern EuropeanEcuadorianEgyptianEnglishEstonianEthiopianEuropeanFijianFilipinoFinnishFrenchFrench American IndianFrench CanadianGermanGerman RussianGhanaianGreekGuamanian/ChamorroGuatemalanGuyaneseHaitianHmongHonduranHopiHoumaHungarianIcelanderIndian (Asian)IndonesianInupiatIranianIraqiIrishIroquoisIsraeliItalianJamaicanJapaneseJordanianKenyanKiowaKoreanLaotianLatvianLebaneseLiberianLithuanianLumbeeLuxembourgerMacedonianMalaysianMalteseMarshalleseMenomineeMexicanMexican American IndianMongolianMoroccanNative HawaiianNavajoNepaleseNew ZealanderNicaraguanNigerianNorthern EuropeanNorwegianOkinawanOsageOttawaPaiutePakistaniPalestinianPanamanianParaguayanPennsylvania GermanPeruvianPimaPolishPortuguesePotawatomiPuebloPuerto RicanPuget Sound SalishRomanianRussianSalvadoranSamoanScandinavianScotch-IrishScottishSeminoleSenegaleseSerbianShoshoneSierra LeoneanSiouxSlavicSlovakSloveneSomaliSouth AfricanSouth AmericanSouth American IndianSoviet UnionSpaniardSpanishSpanish AmericanSpanish American IndianSri LankanSubsaharan AfricanSudaneseSwedishSwissSyrianTaiwaneseThaiTlingit-HaidaTohono O'OdhamTonganTrinidadian and TobagonianTsimshianTurkishU.S. Virgin IslanderUgandanUkrainianUruguayanUteVenezuelanVietnameseWelshWest IndianYakamaYaquiYugoslavianYumanYup'ikZimbabwean
Immigration
NonimmigrantsImmigrantsAfghanistanAfricaAlbaniaArgentinaArmeniaAsiaAustraliaAustriaBangladeshBarbadosBelarusBelgiumBelizeBoliviaBosnia and HerzegovinaBrazilBulgariaBurma/MyanmarCabo VerdeCambodiaCameroonCanadaCaribbeanCentral AmericaChileChinaColombiaCongoCosta RicaCroatiaCubaCzechoslovakiaDenmarkDominicaDominican RepublicEastern AfricaEastern AsiaEastern EuropeEcuadorEgyptEl SalvadorEnglandEritreaEthiopiaEuropeFijiFranceGermanyGhanaGreeceGrenadaGuatemalaGuyanaHaitiHondurasHong KongHungaryIndiaIndonesiaIranIraqIrelandIsraelItalyJamaicaJapanJordanKazakhstanKenyaKoreaKuwaitLaosLatin AmericaLatviaLebanonLiberiaLithuaniaMalaysiaMexicoMicronesiaMiddle AfricaMoldovaMoroccoNepalNetherlandsNicaraguaNigeriaNorth AmericaNorth MacedoniaNorthern AfricaNorthern EuropeNorwayOceaniaPakistanPanamaPeruPhilippinesPolandPortugalRomaniaRussiaSaudi ArabiaScotlandSenegalSerbiaSierra LeoneSingaporeSomaliaSouth AfricaSouth AmericaSouth Central AsiaSouth Eastern AsiaSouthern EuropeSpainSri LankaSt. Vincent and the GrenadinesSudanSwedenSwitzerlandSyriaTaiwanThailandTrinidad and TobagoTurkeyUgandaUkraineUruguayUzbekistanVenezuelaVietnamWest IndiesWestern AfricaWestern AsiaWestern EuropeYemenZaireZimbabweAzores
Immigrants from Bahamas
Race
Ancestry
AfghanAfricanAlaska NativeAlaskan AthabascanAlbanianAleutAlsatianAmericanApacheArabArapahoArgentineanArmenianAssyrian/Chaldean/SyriacAustralianAustrianBahamianBangladeshiBarbadianBasqueBelgianBelizeanBermudanBhutaneseBlackfeetBolivianBrazilianBritishBritish West IndianBulgarianBurmeseCajunCambodianCanadianCape VerdeanCarpatho RusynCelticCentral AmericanCentral American IndianCherokeeCheyenneChickasawChileanChineseChippewaChoctawColombianColvilleComancheCosta RicanCreeCreekCroatianCrowCubanCypriotCzechCzechoslovakianDanishDelawareDominicanDutchDutch West IndianEastern EuropeanEcuadorianEgyptianEnglishEstonianEthiopianEuropeanFijianFilipinoFinnishFrenchFrench American IndianFrench CanadianGermanGerman RussianGhanaianGreekGuamanian/ChamorroGuatemalanGuyaneseHaitianHmongHonduranHopiHoumaHungarianIcelanderIndian (Asian)IndonesianInupiatIranianIraqiIrishIroquoisIsraeliItalianJamaicanJapaneseJordanianKenyanKiowaKoreanLaotianLatvianLebaneseLiberianLithuanianLumbeeLuxembourgerMacedonianMalaysianMalteseMarshalleseMenomineeMexicanMexican American IndianMongolianMoroccanNative HawaiianNavajoNepaleseNew ZealanderNicaraguanNigerianNorthern EuropeanNorwegianOkinawanOsageOttawaPaiutePakistaniPalestinianPanamanianParaguayanPennsylvania GermanPeruvianPimaPolishPortuguesePotawatomiPuebloPuerto RicanPuget Sound SalishRomanianRussianSalvadoranSamoanScandinavianScotch-IrishScottishSeminoleSenegaleseSerbianShoshoneSierra LeoneanSiouxSlavicSlovakSloveneSomaliSouth AfricanSouth AmericanSouth American IndianSoviet UnionSpaniardSpanishSpanish AmericanSpanish American IndianSri LankanSudaneseSwedishSwissSyrianTaiwaneseThaiTlingit-HaidaTohono O'OdhamTonganTrinidadian and TobagonianTsimshianTurkishU.S. Virgin IslanderUgandanUkrainianUruguayanUteVenezuelanVietnameseWelshWest IndianYakamaYaquiYugoslavianYumanYup'ikZimbabwean
Immigration
NonimmigrantsImmigrantsAfghanistanAfricaAlbaniaArgentinaArmeniaAsiaAustraliaAustriaBahamasBangladeshBarbadosBelarusBelgiumBelizeBoliviaBosnia and HerzegovinaBrazilBulgariaBurma/MyanmarCabo VerdeCambodiaCameroonCanadaCaribbeanCentral AmericaChileChinaColombiaCongoCosta RicaCroatiaCubaCzechoslovakiaDenmarkDominicaDominican RepublicEastern AfricaEastern AsiaEastern EuropeEcuadorEgyptEl SalvadorEnglandEritreaEthiopiaEuropeFijiFranceGermanyGhanaGreeceGrenadaGuatemalaGuyanaHaitiHondurasHong KongHungaryIndiaIndonesiaIranIraqIrelandIsraelItalyJamaicaJapanJordanKazakhstanKenyaKoreaKuwaitLaosLatin AmericaLatviaLebanonLiberiaLithuaniaMalaysiaMexicoMicronesiaMiddle AfricaMoldovaMoroccoNepalNetherlandsNicaraguaNigeriaNorth AmericaNorth MacedoniaNorthern AfricaNorthern EuropeNorwayOceaniaPakistanPanamaPeruPhilippinesPolandPortugalRomaniaRussiaSaudi ArabiaScotlandSenegalSerbiaSierra LeoneSingaporeSomaliaSouth AfricaSouth AmericaSouth Central AsiaSouth Eastern AsiaSouthern EuropeSpainSri LankaSt. Vincent and the GrenadinesSudanSwedenSwitzerlandSyriaTaiwanThailandTrinidad and TobagoTurkeyUgandaUkraineUruguayUzbekistanVenezuelaVietnamWest IndiesWestern AfricaWestern AsiaWestern EuropeYemenZaireZimbabweAzores
Householder Income Ages 45 - 64 years
Income
Poverty
Unemployment
Labor Participation
Family Structure
Vehicle Availability
Education Level
Disability

Householder Income Ages 45 - 64 years Comparison

Sub-Saharan Africans

Immigrants from Bahamas

Tragic
Tragic
$90,691
HOUSEHOLDER INCOME AGES 45 - 64 YEARS
0.8/ 100
METRIC RATING
250th/ 347
METRIC RANK
$83,177
HOUSEHOLDER INCOME AGES 45 - 64 YEARS
0.0/ 100
METRIC RATING
311th/ 347
METRIC RANK

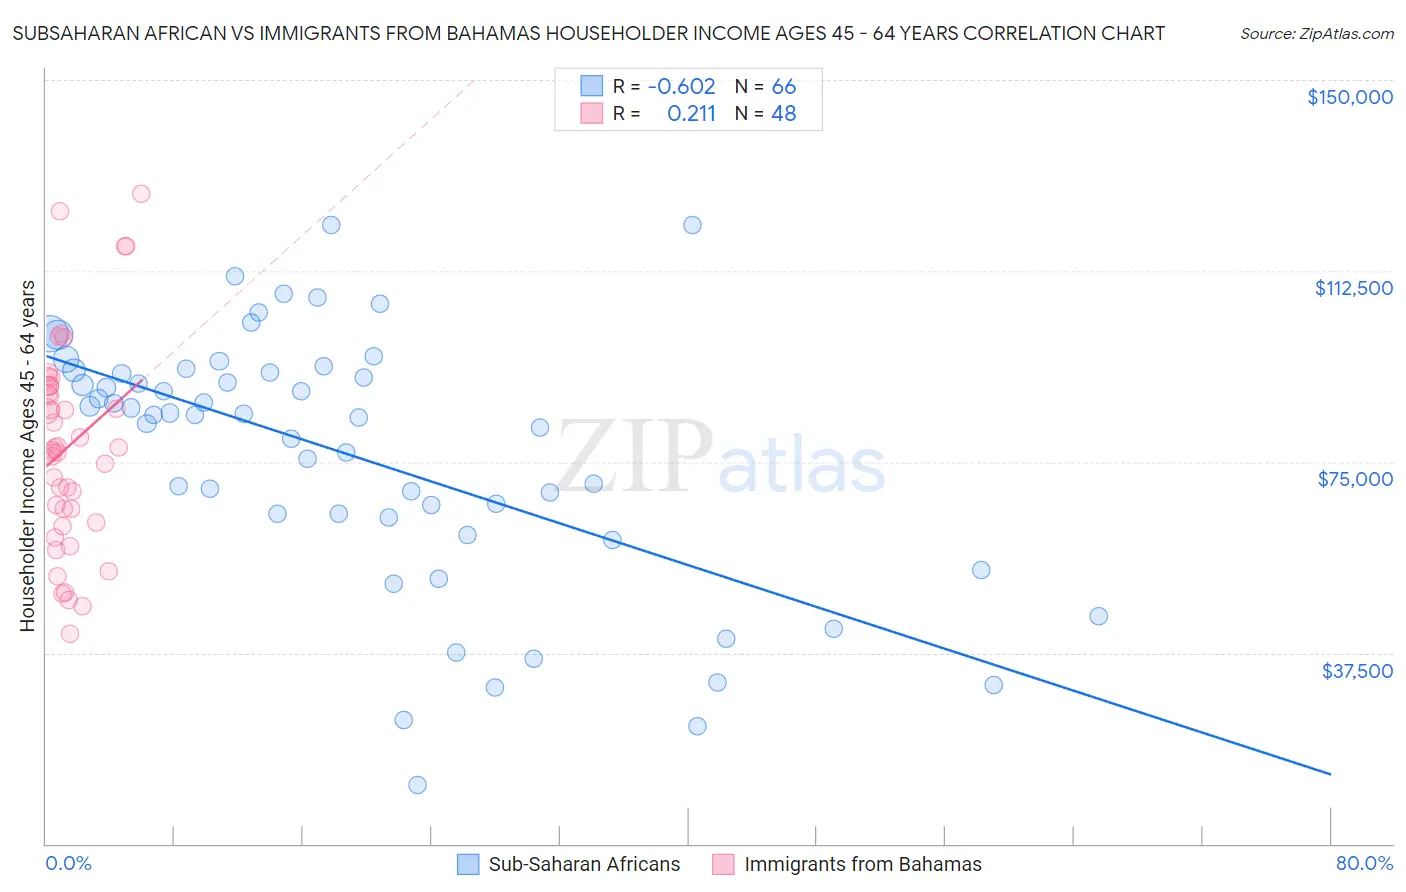
Subsaharan African vs Immigrants from Bahamas Householder Income Ages 45 - 64 years Correlation Chart

The statistical analysis conducted on geographies consisting of 506,198,662 people shows a significant negative correlation between the proportion of Sub-Saharan Africans and household income with householder between the ages 45 and 64 in the United States with a correlation coefficient (R) of -0.602 and weighted average of $90,691. Similarly, the statistical analysis conducted on geographies consisting of 104,531,402 people shows a weak positive correlation between the proportion of Immigrants from Bahamas and household income with householder between the ages 45 and 64 in the United States with a correlation coefficient (R) of 0.211 and weighted average of $83,177, a difference of 9.0%.
Subsaharan African vs Immigrants from Bahamas Householder Income Ages 45 - 64 years

Householder Income Ages 45 - 64 years Correlation Summary

MeasurementSubsaharan AfricanImmigrants from Bahamas
Minimum$11,458$41,195
Maximum$121,610$127,688
Range$110,152$86,493
Mean$76,045$78,060
Median$84,198$77,570
Interquartile 25% (IQ1)$64,056$64,406
Interquartile 75% (IQ3)$92,645$89,869
Interquartile Range (IQR)$28,589$25,463
Standard Deviation (Sample)$25,098$20,104
Standard Deviation (Population)$24,907$19,893

Similar Demographics by Householder Income Ages 45 - 64 years

Demographics Similar to Sub-Saharan Africans by Householder Income Ages 45 - 64 years

In terms of householder income ages 45 - 64 years, the demographic groups most similar to Sub-Saharan Africans are Mexican American Indian ($90,811, a difference of 0.13%), American ($90,536, a difference of 0.17%), Immigrants from Laos ($90,909, a difference of 0.24%), Marshallese ($90,455, a difference of 0.26%), and Central American ($90,951, a difference of 0.29%).
DemographicsRating | RankHouseholder Income Ages 45 - 64 years
Immigrants | Trinidad and Tobago
1.1
/100
|
#243
Tragic
$91,347
Immigrants | Middle Africa
1.1
/100
|
#244
Tragic
$91,293
Guyanese
0.9
/100
|
#245
Tragic
$90,966
Central Americans
0.9
/100
|
#246
Tragic
$90,951
Alaskan Athabascans
0.9
/100
|
#247
Tragic
$90,951
Immigrants | Laos
0.9
/100
|
#248
Tragic
$90,909
Mexican American Indians
0.8
/100
|
#249
Tragic
$90,811
Sub-Saharan Africans
0.8
/100
|
#250
Tragic
$90,691
Americans
0.7
/100
|
#251
Tragic
$90,536
Marshallese
0.7
/100
|
#252
Tragic
$90,455
Barbadians
0.6
/100
|
#253
Tragic
$90,266
Immigrants | Guyana
0.6
/100
|
#254
Tragic
$90,186
West Indians
0.5
/100
|
#255
Tragic
$89,906
French American Indians
0.5
/100
|
#256
Tragic
$89,811
German Russians
0.4
/100
|
#257
Tragic
$89,398

Demographics Similar to Immigrants from Bahamas by Householder Income Ages 45 - 64 years

In terms of householder income ages 45 - 64 years, the demographic groups most similar to Immigrants from Bahamas are Immigrants from Haiti ($83,257, a difference of 0.10%), Immigrants from Dominica ($83,311, a difference of 0.16%), Cajun ($83,015, a difference of 0.20%), Immigrants from Cabo Verde ($83,542, a difference of 0.44%), and Shoshone ($83,588, a difference of 0.49%).
DemographicsRating | RankHouseholder Income Ages 45 - 64 years
Ottawa
0.0
/100
|
#304
Tragic
$83,953
Chippewa
0.0
/100
|
#305
Tragic
$83,943
Ute
0.0
/100
|
#306
Tragic
$83,937
Shoshone
0.0
/100
|
#307
Tragic
$83,588
Immigrants | Cabo Verde
0.0
/100
|
#308
Tragic
$83,542
Immigrants | Dominica
0.0
/100
|
#309
Tragic
$83,311
Immigrants | Haiti
0.0
/100
|
#310
Tragic
$83,257
Immigrants | Bahamas
0.0
/100
|
#311
Tragic
$83,177
Cajuns
0.0
/100
|
#312
Tragic
$83,015
U.S. Virgin Islanders
0.0
/100
|
#313
Tragic
$82,736
Immigrants | Honduras
0.0
/100
|
#314
Tragic
$82,697
Paiute
0.0
/100
|
#315
Tragic
$82,629
Immigrants | Caribbean
0.0
/100
|
#316
Tragic
$82,513
Colville
0.0
/100
|
#317
Tragic
$82,474
Choctaw
0.0
/100
|
#318
Tragic
$82,287