Slovene vs Houma Median Earnings
COMPARE
Slovene
Houma
Median Earnings
Median Earnings Comparison
Slovenes
Houma
$47,995
MEDIAN EARNINGS
90.0/ 100
METRIC RATING
136th/ 347
METRIC RANK
$38,949
MEDIAN EARNINGS
0.0/ 100
METRIC RATING
333rd/ 347
METRIC RANK
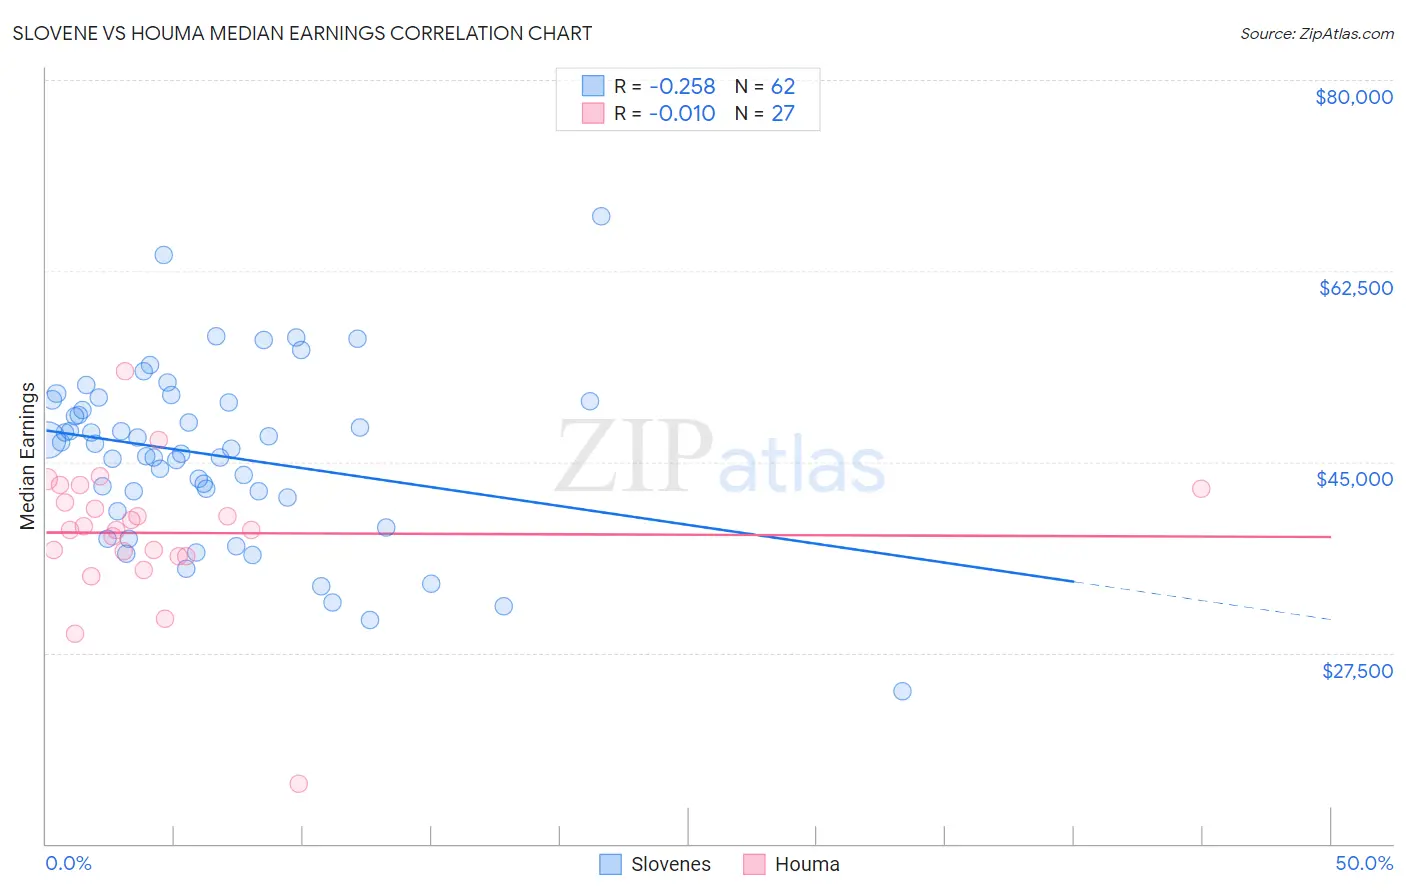
Slovene vs Houma Median Earnings Correlation Chart
The statistical analysis conducted on geographies consisting of 261,342,703 people shows a weak negative correlation between the proportion of Slovenes and median earnings in the United States with a correlation coefficient (R) of -0.258 and weighted average of $47,995. Similarly, the statistical analysis conducted on geographies consisting of 36,796,366 people shows no correlation between the proportion of Houma and median earnings in the United States with a correlation coefficient (R) of -0.010 and weighted average of $38,949, a difference of 23.2%.
Median Earnings Correlation Summary
| Measurement | Slovene | Houma |
| Minimum | $24,000 | $15,495 |
| Maximum | $67,559 | $53,358 |
| Range | $43,559 | $37,863 |
| Mean | $45,611 | $38,485 |
| Median | $46,389 | $38,771 |
| Interquartile 25% (IQ1) | $41,769 | $36,392 |
| Interquartile 75% (IQ3) | $50,577 | $42,500 |
| Interquartile Range (IQR) | $8,808 | $6,108 |
| Standard Deviation (Sample) | $7,962 | $6,619 |
| Standard Deviation (Population) | $7,897 | $6,495 |
Similar Demographics by Median Earnings
Demographics Similar to Slovenes by Median Earnings
In terms of median earnings, the demographic groups most similar to Slovenes are Portuguese ($48,032, a difference of 0.080%), Sri Lankan ($48,040, a difference of 0.090%), Immigrants from Uganda ($48,041, a difference of 0.10%), Immigrants from Nepal ($47,925, a difference of 0.15%), and European ($47,915, a difference of 0.17%).
| Demographics | Rating | Rank | Median Earnings |
| Pakistanis | 92.8 /100 | #129 | Exceptional $48,254 |
| Zimbabweans | 92.6 /100 | #130 | Exceptional $48,229 |
| Lebanese | 92.5 /100 | #131 | Exceptional $48,226 |
| British | 92.2 /100 | #132 | Exceptional $48,189 |
| Immigrants | Uganda | 90.5 /100 | #133 | Exceptional $48,041 |
| Sri Lankans | 90.5 /100 | #134 | Exceptional $48,040 |
| Portuguese | 90.4 /100 | #135 | Exceptional $48,032 |
| Slovenes | 90.0 /100 | #136 | Excellent $47,995 |
| Immigrants | Nepal | 89.0 /100 | #137 | Excellent $47,925 |
| Europeans | 88.9 /100 | #138 | Excellent $47,915 |
| Canadians | 88.8 /100 | #139 | Excellent $47,911 |
| Taiwanese | 88.7 /100 | #140 | Excellent $47,902 |
| Immigrants | Sierra Leone | 88.3 /100 | #141 | Excellent $47,875 |
| Ugandans | 88.0 /100 | #142 | Excellent $47,854 |
| Swedes | 88.0 /100 | #143 | Excellent $47,851 |
Demographics Similar to Houma by Median Earnings
In terms of median earnings, the demographic groups most similar to Houma are Spanish American Indian ($38,907, a difference of 0.11%), Native/Alaskan ($38,896, a difference of 0.14%), Yakama ($39,107, a difference of 0.41%), Immigrants from Mexico ($39,114, a difference of 0.42%), and Immigrants from Congo ($39,169, a difference of 0.57%).
| Demographics | Rating | Rank | Median Earnings |
| Immigrants | Yemen | 0.0 /100 | #326 | Tragic $39,540 |
| Yuman | 0.0 /100 | #327 | Tragic $39,523 |
| Sioux | 0.0 /100 | #328 | Tragic $39,448 |
| Kiowa | 0.0 /100 | #329 | Tragic $39,232 |
| Immigrants | Congo | 0.0 /100 | #330 | Tragic $39,169 |
| Immigrants | Mexico | 0.0 /100 | #331 | Tragic $39,114 |
| Yakama | 0.0 /100 | #332 | Tragic $39,107 |
| Houma | 0.0 /100 | #333 | Tragic $38,949 |
| Spanish American Indians | 0.0 /100 | #334 | Tragic $38,907 |
| Natives/Alaskans | 0.0 /100 | #335 | Tragic $38,896 |
| Crow | 0.0 /100 | #336 | Tragic $38,707 |
| Immigrants | Cuba | 0.0 /100 | #337 | Tragic $38,426 |
| Pima | 0.0 /100 | #338 | Tragic $38,285 |
| Menominee | 0.0 /100 | #339 | Tragic $37,884 |
| Navajo | 0.0 /100 | #340 | Tragic $36,999 |