Slovak vs Immigrants from Haiti Householder Income Under 25 years
COMPARE
Slovak
Immigrants from Haiti
Householder Income Under 25 years
Householder Income Under 25 years Comparison
Slovaks
Immigrants from Haiti
$49,753
HOUSEHOLDER INCOME UNDER 25 YEARS
0.3/ 100
METRIC RATING
273rd/ 347
METRIC RANK
$50,398
HOUSEHOLDER INCOME UNDER 25 YEARS
1.2/ 100
METRIC RATING
253rd/ 347
METRIC RANK
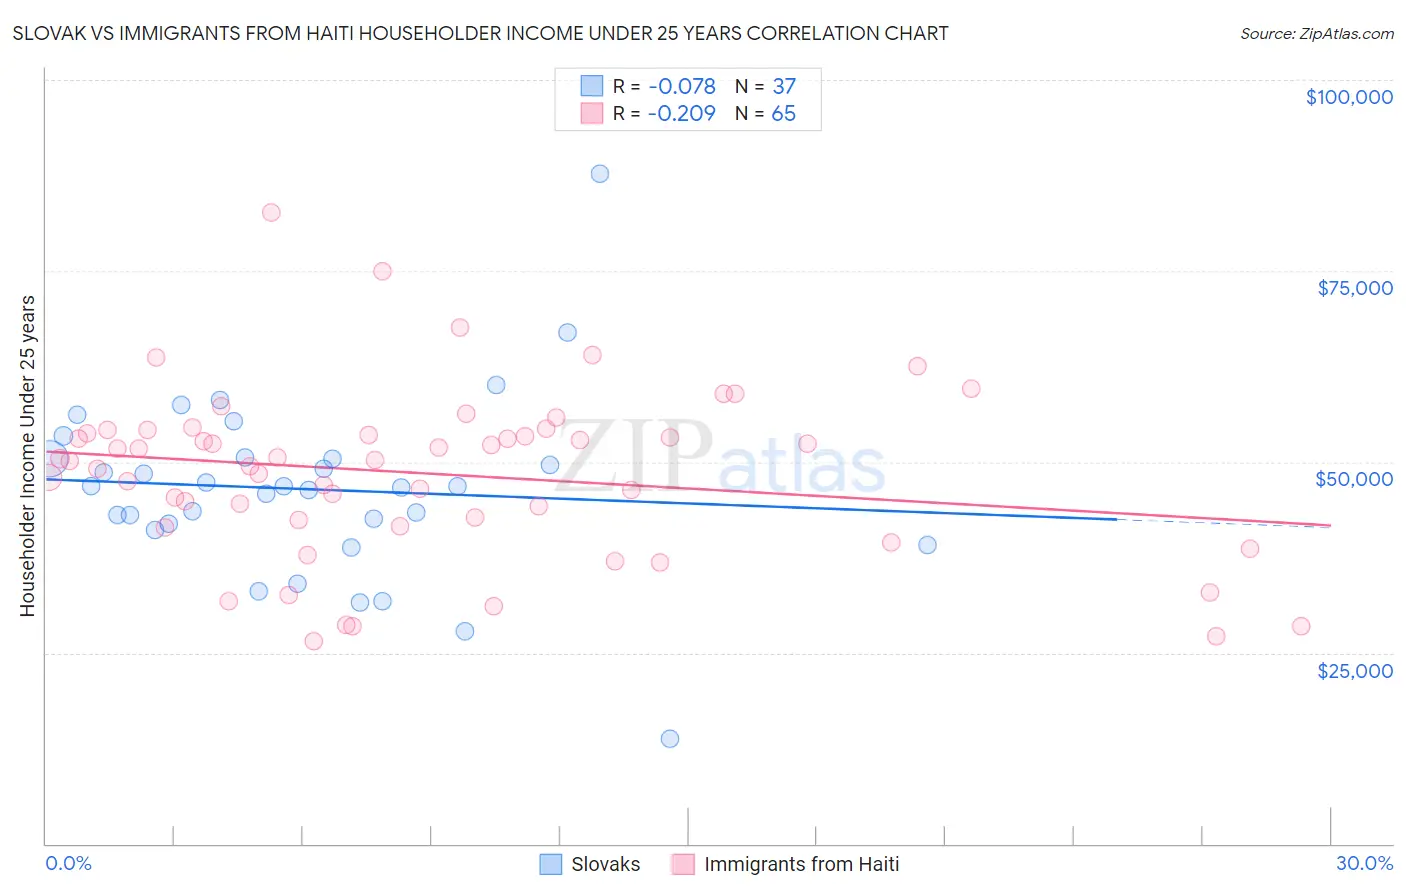
Slovak vs Immigrants from Haiti Householder Income Under 25 years Correlation Chart
The statistical analysis conducted on geographies consisting of 328,630,657 people shows a slight negative correlation between the proportion of Slovaks and household income with householder under the age of 25 in the United States with a correlation coefficient (R) of -0.078 and weighted average of $49,753. Similarly, the statistical analysis conducted on geographies consisting of 194,658,893 people shows a weak negative correlation between the proportion of Immigrants from Haiti and household income with householder under the age of 25 in the United States with a correlation coefficient (R) of -0.209 and weighted average of $50,398, a difference of 1.3%.
Householder Income Under 25 years Correlation Summary
| Measurement | Slovak | Immigrants from Haiti |
| Minimum | $13,750 | $26,470 |
| Maximum | $87,793 | $82,635 |
| Range | $74,043 | $56,166 |
| Mean | $46,421 | $48,468 |
| Median | $46,765 | $50,234 |
| Interquartile 25% (IQ1) | $41,531 | $41,992 |
| Interquartile 75% (IQ3) | $50,443 | $53,925 |
| Interquartile Range (IQR) | $8,912 | $11,932 |
| Standard Deviation (Sample) | $12,103 | $11,076 |
| Standard Deviation (Population) | $11,938 | $10,991 |
Demographics Similar to Slovaks and Immigrants from Haiti by Householder Income Under 25 years
In terms of householder income under 25 years, the demographic groups most similar to Slovaks are Colville ($49,774, a difference of 0.040%), Taiwanese ($49,804, a difference of 0.10%), Mexican ($49,989, a difference of 0.48%), Ute ($49,997, a difference of 0.49%), and Venezuelan ($50,011, a difference of 0.52%). Similarly, the demographic groups most similar to Immigrants from Haiti are Luxembourger ($50,379, a difference of 0.040%), Aleut ($50,377, a difference of 0.040%), Immigrants from Cuba ($50,374, a difference of 0.050%), Lebanese ($50,355, a difference of 0.090%), and White/Caucasian ($50,336, a difference of 0.12%).
| Demographics | Rating | Rank | Householder Income Under 25 years |
| Immigrants | Haiti | 1.2 /100 | #253 | Tragic $50,398 |
| Luxembourgers | 1.2 /100 | #254 | Tragic $50,379 |
| Aleuts | 1.2 /100 | #255 | Tragic $50,377 |
| Immigrants | Cuba | 1.2 /100 | #256 | Tragic $50,374 |
| Lebanese | 1.1 /100 | #257 | Tragic $50,355 |
| Whites/Caucasians | 1.1 /100 | #258 | Tragic $50,336 |
| Immigrants | Dominica | 1.0 /100 | #259 | Tragic $50,301 |
| Hispanics or Latinos | 0.9 /100 | #260 | Tragic $50,279 |
| Hungarians | 0.9 /100 | #261 | Tragic $50,247 |
| Haitians | 0.8 /100 | #262 | Tragic $50,231 |
| Immigrants | Dominican Republic | 0.8 /100 | #263 | Tragic $50,204 |
| Fijians | 0.6 /100 | #264 | Tragic $50,132 |
| Belgians | 0.6 /100 | #265 | Tragic $50,113 |
| Immigrants | Venezuela | 0.6 /100 | #266 | Tragic $50,109 |
| Immigrants | Laos | 0.5 /100 | #267 | Tragic $50,041 |
| Venezuelans | 0.5 /100 | #268 | Tragic $50,011 |
| Ute | 0.5 /100 | #269 | Tragic $49,997 |
| Mexicans | 0.5 /100 | #270 | Tragic $49,989 |
| Taiwanese | 0.3 /100 | #271 | Tragic $49,804 |
| Colville | 0.3 /100 | #272 | Tragic $49,774 |
| Slovaks | 0.3 /100 | #273 | Tragic $49,753 |