Russian vs Syrian Median Household Income
COMPARE
Russian
Syrian
Median Household Income
Median Household Income Comparison
Russians
Syrians
$98,008
MEDIAN HOUSEHOLD INCOME
100.0/ 100
METRIC RATING
34th/ 347
METRIC RANK
$89,830
MEDIAN HOUSEHOLD INCOME
95.4/ 100
METRIC RATING
118th/ 347
METRIC RANK
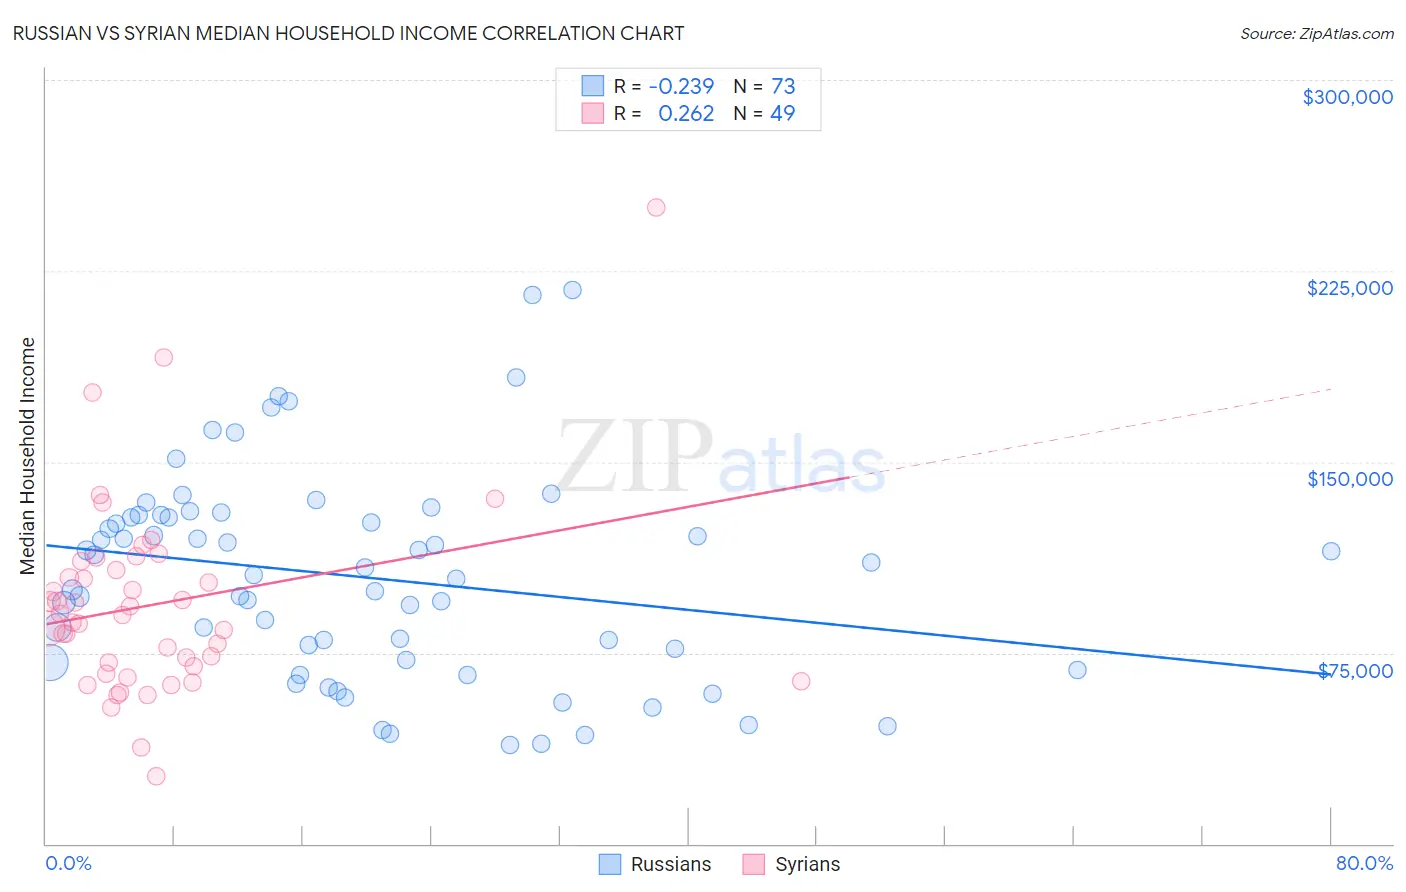
Russian vs Syrian Median Household Income Correlation Chart
The statistical analysis conducted on geographies consisting of 511,515,990 people shows a weak negative correlation between the proportion of Russians and median household income in the United States with a correlation coefficient (R) of -0.239 and weighted average of $98,008. Similarly, the statistical analysis conducted on geographies consisting of 266,119,923 people shows a weak positive correlation between the proportion of Syrians and median household income in the United States with a correlation coefficient (R) of 0.262 and weighted average of $89,830, a difference of 9.1%.
Median Household Income Correlation Summary
| Measurement | Russian | Syrian |
| Minimum | $38,750 | $26,364 |
| Maximum | $217,375 | $250,001 |
| Range | $178,625 | $223,637 |
| Mean | $104,714 | $94,106 |
| Median | $105,523 | $89,903 |
| Interquartile 25% (IQ1) | $71,539 | $68,162 |
| Interquartile 75% (IQ3) | $128,679 | $109,343 |
| Interquartile Range (IQR) | $57,140 | $41,181 |
| Standard Deviation (Sample) | $40,584 | $38,336 |
| Standard Deviation (Population) | $40,305 | $37,943 |
Similar Demographics by Median Household Income
Demographics Similar to Russians by Median Household Income
In terms of median household income, the demographic groups most similar to Russians are Immigrants from Switzerland ($97,979, a difference of 0.030%), Immigrants from Pakistan ($97,528, a difference of 0.49%), Chinese ($98,496, a difference of 0.50%), Immigrants from Denmark ($98,510, a difference of 0.51%), and Latvian ($97,311, a difference of 0.72%).
| Demographics | Rating | Rank | Median Household Income |
| Bhutanese | 100.0 /100 | #27 | Exceptional $100,151 |
| Immigrants | Sri Lanka | 100.0 /100 | #28 | Exceptional $99,943 |
| Immigrants | Asia | 100.0 /100 | #29 | Exceptional $99,933 |
| Immigrants | Northern Europe | 100.0 /100 | #30 | Exceptional $99,813 |
| Turks | 100.0 /100 | #31 | Exceptional $99,389 |
| Immigrants | Denmark | 100.0 /100 | #32 | Exceptional $98,510 |
| Chinese | 100.0 /100 | #33 | Exceptional $98,496 |
| Russians | 100.0 /100 | #34 | Exceptional $98,008 |
| Immigrants | Switzerland | 100.0 /100 | #35 | Exceptional $97,979 |
| Immigrants | Pakistan | 100.0 /100 | #36 | Exceptional $97,528 |
| Latvians | 100.0 /100 | #37 | Exceptional $97,311 |
| Immigrants | Indonesia | 100.0 /100 | #38 | Exceptional $97,297 |
| Afghans | 100.0 /100 | #39 | Exceptional $97,026 |
| Maltese | 100.0 /100 | #40 | Exceptional $97,015 |
| Immigrants | Turkey | 100.0 /100 | #41 | Exceptional $96,964 |
Demographics Similar to Syrians by Median Household Income
In terms of median household income, the demographic groups most similar to Syrians are Taiwanese ($89,900, a difference of 0.080%), Native Hawaiian ($89,919, a difference of 0.10%), Albanian ($89,744, a difference of 0.10%), Immigrants from North Macedonia ($89,741, a difference of 0.10%), and Immigrants from Western Asia ($90,005, a difference of 0.19%).
| Demographics | Rating | Rank | Median Household Income |
| Immigrants | Poland | 97.1 /100 | #111 | Exceptional $90,549 |
| Northern Europeans | 96.9 /100 | #112 | Exceptional $90,446 |
| Peruvians | 96.5 /100 | #113 | Exceptional $90,261 |
| Immigrants | Northern Africa | 95.9 /100 | #114 | Exceptional $90,026 |
| Immigrants | Western Asia | 95.9 /100 | #115 | Exceptional $90,005 |
| Native Hawaiians | 95.7 /100 | #116 | Exceptional $89,919 |
| Taiwanese | 95.6 /100 | #117 | Exceptional $89,900 |
| Syrians | 95.4 /100 | #118 | Exceptional $89,830 |
| Albanians | 95.2 /100 | #119 | Exceptional $89,744 |
| Immigrants | North Macedonia | 95.2 /100 | #120 | Exceptional $89,741 |
| Ethiopians | 94.9 /100 | #121 | Exceptional $89,640 |
| Pakistanis | 94.8 /100 | #122 | Exceptional $89,638 |
| Immigrants | Zimbabwe | 94.4 /100 | #123 | Exceptional $89,496 |
| Immigrants | Jordan | 94.1 /100 | #124 | Exceptional $89,412 |
| Immigrants | Kuwait | 93.5 /100 | #125 | Exceptional $89,263 |