Romanian vs Immigrants from Switzerland Median Household Income

COMPARE

Romanian
Race
Ancestry
AfghanAfricanAlaska NativeAlaskan AthabascanAlbanianAleutAlsatianAmericanApacheArabArapahoArgentineanArmenianAssyrian/Chaldean/SyriacAustralianAustrianBahamianBangladeshiBarbadianBasqueBelgianBelizeanBermudanBhutaneseBlackfeetBolivianBrazilianBritishBritish West IndianBulgarianBurmeseCajunCambodianCanadianCape VerdeanCarpatho RusynCelticCentral AmericanCentral American IndianCherokeeCheyenneChickasawChileanChineseChippewaChoctawColombianColvilleComancheCosta RicanCreeCreekCroatianCrowCubanCypriotCzechCzechoslovakianDanishDelawareDominicanDutchDutch West IndianEastern EuropeanEcuadorianEgyptianEnglishEstonianEthiopianEuropeanFijianFilipinoFinnishFrenchFrench American IndianFrench CanadianGermanGerman RussianGhanaianGreekGuamanian/ChamorroGuatemalanGuyaneseHaitianHmongHonduranHopiHoumaHungarianIcelanderIndian (Asian)IndonesianInupiatIranianIraqiIrishIroquoisIsraeliItalianJamaicanJapaneseJordanianKenyanKiowaKoreanLaotianLatvianLebaneseLiberianLithuanianLumbeeLuxembourgerMacedonianMalaysianMalteseMarshalleseMenomineeMexicanMexican American IndianMongolianMoroccanNative HawaiianNavajoNepaleseNew ZealanderNicaraguanNigerianNorthern EuropeanNorwegianOkinawanOsageOttawaPaiutePakistaniPalestinianPanamanianParaguayanPennsylvania GermanPeruvianPimaPolishPortuguesePotawatomiPuebloPuerto RicanPuget Sound SalishRomanianRussianSalvadoranSamoanScandinavianScotch-IrishScottishSeminoleSenegaleseSerbianShoshoneSierra LeoneanSiouxSlavicSlovakSloveneSomaliSouth AfricanSouth AmericanSouth American IndianSoviet UnionSpaniardSpanishSpanish AmericanSpanish American IndianSri LankanSubsaharan AfricanSudaneseSwedishSwissSyrianTaiwaneseThaiTlingit-HaidaTohono O'OdhamTonganTrinidadian and TobagonianTsimshianTurkishU.S. Virgin IslanderUgandanUkrainianUruguayanUteVenezuelanVietnameseWelshWest IndianYakamaYaquiYugoslavianYumanYup'ikZimbabwean
Immigration
NonimmigrantsImmigrantsAfghanistanAfricaAlbaniaArgentinaArmeniaAsiaAustraliaAustriaBahamasBangladeshBarbadosBelarusBelgiumBelizeBoliviaBosnia and HerzegovinaBrazilBulgariaBurma/MyanmarCabo VerdeCambodiaCameroonCanadaCaribbeanCentral AmericaChileChinaColombiaCongoCosta RicaCroatiaCubaCzechoslovakiaDenmarkDominicaDominican RepublicEastern AfricaEastern AsiaEastern EuropeEcuadorEgyptEl SalvadorEnglandEritreaEthiopiaEuropeFijiFranceGermanyGhanaGreeceGrenadaGuatemalaGuyanaHaitiHondurasHong KongHungaryIndiaIndonesiaIranIraqIrelandIsraelItalyJamaicaJapanJordanKazakhstanKenyaKoreaKuwaitLaosLatin AmericaLatviaLebanonLiberiaLithuaniaMalaysiaMexicoMicronesiaMiddle AfricaMoldovaMoroccoNepalNetherlandsNicaraguaNigeriaNorth AmericaNorth MacedoniaNorthern AfricaNorthern EuropeNorwayOceaniaPakistanPanamaPeruPhilippinesPolandPortugalRomaniaRussiaSaudi ArabiaScotlandSenegalSerbiaSierra LeoneSingaporeSomaliaSouth AfricaSouth AmericaSouth Central AsiaSouth Eastern AsiaSouthern EuropeSpainSri LankaSt. Vincent and the GrenadinesSudanSwedenSyriaTaiwanThailandTrinidad and TobagoTurkeyUgandaUkraineUruguayUzbekistanVenezuelaVietnamWest IndiesWestern AfricaWestern AsiaWestern EuropeYemenZaireZimbabweAzores
Immigrants from Switzerland
Race
Ancestry
AfghanAfricanAlaska NativeAlaskan AthabascanAlbanianAleutAlsatianAmericanApacheArabArapahoArgentineanArmenianAssyrian/Chaldean/SyriacAustralianAustrianBahamianBangladeshiBarbadianBasqueBelgianBelizeanBermudanBhutaneseBlackfeetBolivianBrazilianBritishBritish West IndianBulgarianBurmeseCajunCambodianCanadianCape VerdeanCarpatho RusynCelticCentral AmericanCentral American IndianCherokeeCheyenneChickasawChileanChineseChippewaChoctawColombianColvilleComancheCosta RicanCreeCreekCroatianCrowCubanCypriotCzechCzechoslovakianDanishDelawareDominicanDutchDutch West IndianEastern EuropeanEcuadorianEgyptianEnglishEstonianEthiopianEuropeanFijianFilipinoFinnishFrenchFrench American IndianFrench CanadianGermanGerman RussianGhanaianGreekGuamanian/ChamorroGuatemalanGuyaneseHaitianHmongHonduranHopiHoumaHungarianIcelanderIndian (Asian)IndonesianInupiatIranianIraqiIrishIroquoisIsraeliItalianJamaicanJapaneseJordanianKenyanKiowaKoreanLaotianLatvianLebaneseLiberianLithuanianLumbeeLuxembourgerMacedonianMalaysianMalteseMarshalleseMenomineeMexicanMexican American IndianMongolianMoroccanNative HawaiianNavajoNepaleseNew ZealanderNicaraguanNigerianNorthern EuropeanNorwegianOkinawanOsageOttawaPaiutePakistaniPalestinianPanamanianParaguayanPennsylvania GermanPeruvianPimaPolishPortuguesePotawatomiPuebloPuerto RicanPuget Sound SalishRussianSalvadoranSamoanScandinavianScotch-IrishScottishSeminoleSenegaleseSerbianShoshoneSierra LeoneanSiouxSlavicSlovakSloveneSomaliSouth AfricanSouth AmericanSouth American IndianSoviet UnionSpaniardSpanishSpanish AmericanSpanish American IndianSri LankanSubsaharan AfricanSudaneseSwedishSwissSyrianTaiwaneseThaiTlingit-HaidaTohono O'OdhamTonganTrinidadian and TobagonianTsimshianTurkishU.S. Virgin IslanderUgandanUkrainianUruguayanUteVenezuelanVietnameseWelshWest IndianYakamaYaquiYugoslavianYumanYup'ikZimbabwean
Immigration
NonimmigrantsImmigrantsAfghanistanAfricaAlbaniaArgentinaArmeniaAsiaAustraliaAustriaBahamasBangladeshBarbadosBelarusBelgiumBelizeBoliviaBosnia and HerzegovinaBrazilBulgariaBurma/MyanmarCabo VerdeCambodiaCameroonCanadaCaribbeanCentral AmericaChileChinaColombiaCongoCosta RicaCroatiaCubaCzechoslovakiaDenmarkDominicaDominican RepublicEastern AfricaEastern AsiaEastern EuropeEcuadorEgyptEl SalvadorEnglandEritreaEthiopiaEuropeFijiFranceGermanyGhanaGreeceGrenadaGuatemalaGuyanaHaitiHondurasHong KongHungaryIndiaIndonesiaIranIraqIrelandIsraelItalyJamaicaJapanJordanKazakhstanKenyaKoreaKuwaitLaosLatin AmericaLatviaLebanonLiberiaLithuaniaMalaysiaMexicoMicronesiaMiddle AfricaMoldovaMoroccoNepalNetherlandsNicaraguaNigeriaNorth AmericaNorth MacedoniaNorthern AfricaNorthern EuropeNorwayOceaniaPakistanPanamaPeruPhilippinesPolandPortugalRomaniaRussiaSaudi ArabiaScotlandSenegalSerbiaSierra LeoneSingaporeSomaliaSouth AfricaSouth AmericaSouth Central AsiaSouth Eastern AsiaSouthern EuropeSpainSri LankaSt. Vincent and the GrenadinesSudanSwedenSwitzerlandSyriaTaiwanThailandTrinidad and TobagoTurkeyUgandaUkraineUruguayUzbekistanVenezuelaVietnamWest IndiesWestern AfricaWestern AsiaWestern EuropeYemenZaireZimbabweAzores
Median Household Income
Income
Poverty
Unemployment
Labor Participation
Family Structure
Vehicle Availability
Education Level
Disability

Median Household Income Comparison

Romanians

Immigrants from Switzerland

Exceptional
Exceptional
$91,994
MEDIAN HOUSEHOLD INCOME
98.8/ 100
METRIC RATING
89th/ 347
METRIC RANK
$97,979
MEDIAN HOUSEHOLD INCOME
100.0/ 100
METRIC RATING
35th/ 347
METRIC RANK

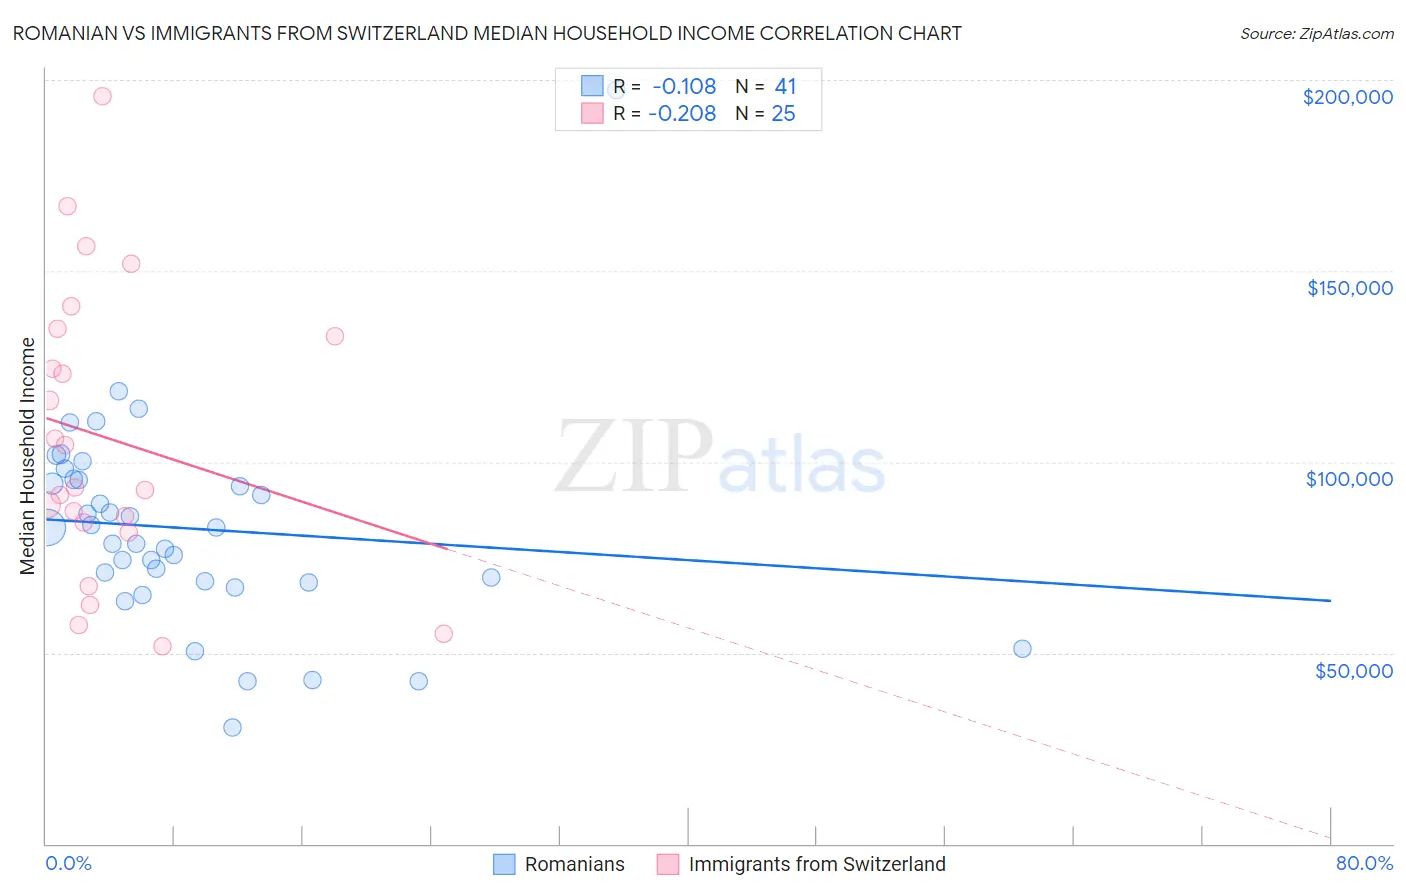
Romanian vs Immigrants from Switzerland Median Household Income Correlation Chart

The statistical analysis conducted on geographies consisting of 377,637,037 people shows a poor negative correlation between the proportion of Romanians and median household income in the United States with a correlation coefficient (R) of -0.108 and weighted average of $91,994. Similarly, the statistical analysis conducted on geographies consisting of 148,056,974 people shows a weak negative correlation between the proportion of Immigrants from Switzerland and median household income in the United States with a correlation coefficient (R) of -0.208 and weighted average of $97,979, a difference of 6.5%.
Romanian vs Immigrants from Switzerland Median Household Income

Median Household Income Correlation Summary

MeasurementRomanianImmigrants from Switzerland
Minimum$30,320$51,573
Maximum$197,500$195,586
Range$167,180$144,013
Mean$82,526$106,072
Median$82,785$93,190
Interquartile 25% (IQ1)$68,581$82,852
Interquartile 75% (IQ3)$95,353$133,796
Interquartile Range (IQR)$26,772$50,943
Standard Deviation (Sample)$27,672$37,589
Standard Deviation (Population)$27,332$36,829

Similar Demographics by Median Household Income

Demographics Similar to Romanians by Median Household Income

In terms of median household income, the demographic groups most similar to Romanians are Assyrian/Chaldean/Syriac ($91,991, a difference of 0.0%), Immigrants from Vietnam ($91,987, a difference of 0.010%), Immigrants from Canada ($92,029, a difference of 0.040%), Immigrants from Western Europe ($91,936, a difference of 0.060%), and Immigrants from England ($92,098, a difference of 0.11%).
DemographicsRating | RankMedian Household Income
Immigrants | Spain
99.3
/100
|
#82
Exceptional
$92,732
Italians
99.1
/100
|
#83
Exceptional
$92,475
Immigrants | Argentina
99.1
/100
|
#84
Exceptional
$92,417
Immigrants | Croatia
99.0
/100
|
#85
Exceptional
$92,225
Immigrants | England
98.9
/100
|
#86
Exceptional
$92,098
Immigrants | Hungary
98.9
/100
|
#87
Exceptional
$92,094
Immigrants | Canada
98.8
/100
|
#88
Exceptional
$92,029
Romanians
98.8
/100
|
#89
Exceptional
$91,994
Assyrians/Chaldeans/Syriacs
98.8
/100
|
#90
Exceptional
$91,991
Immigrants | Vietnam
98.8
/100
|
#91
Exceptional
$91,987
Immigrants | Western Europe
98.8
/100
|
#92
Exceptional
$91,936
Immigrants | Lebanon
98.7
/100
|
#93
Exceptional
$91,887
Immigrants | North America
98.7
/100
|
#94
Exceptional
$91,860
Armenians
98.7
/100
|
#95
Exceptional
$91,807
Jordanians
98.7
/100
|
#96
Exceptional
$91,794

Demographics Similar to Immigrants from Switzerland by Median Household Income

In terms of median household income, the demographic groups most similar to Immigrants from Switzerland are Russian ($98,008, a difference of 0.030%), Immigrants from Pakistan ($97,528, a difference of 0.46%), Chinese ($98,496, a difference of 0.53%), Immigrants from Denmark ($98,510, a difference of 0.54%), and Latvian ($97,311, a difference of 0.69%).
DemographicsRating | RankMedian Household Income
Immigrants | Sri Lanka
100.0
/100
|
#28
Exceptional
$99,943
Immigrants | Asia
100.0
/100
|
#29
Exceptional
$99,933
Immigrants | Northern Europe
100.0
/100
|
#30
Exceptional
$99,813
Turks
100.0
/100
|
#31
Exceptional
$99,389
Immigrants | Denmark
100.0
/100
|
#32
Exceptional
$98,510
Chinese
100.0
/100
|
#33
Exceptional
$98,496
Russians
100.0
/100
|
#34
Exceptional
$98,008
Immigrants | Switzerland
100.0
/100
|
#35
Exceptional
$97,979
Immigrants | Pakistan
100.0
/100
|
#36
Exceptional
$97,528
Latvians
100.0
/100
|
#37
Exceptional
$97,311
Immigrants | Indonesia
100.0
/100
|
#38
Exceptional
$97,297
Afghans
100.0
/100
|
#39
Exceptional
$97,026
Maltese
100.0
/100
|
#40
Exceptional
$97,015
Immigrants | Turkey
100.0
/100
|
#41
Exceptional
$96,964
Immigrants | Lithuania
99.9
/100
|
#42
Exceptional
$96,836