Romanian vs Immigrants from Barbados Median Female Earnings
COMPARE
Romanian
Immigrants from Barbados
Median Female Earnings
Median Female Earnings Comparison
Romanians
Immigrants from Barbados
$41,663
MEDIAN FEMALE EARNINGS
98.3/ 100
METRIC RATING
100th/ 347
METRIC RANK
$41,685
MEDIAN FEMALE EARNINGS
98.4/ 100
METRIC RATING
99th/ 347
METRIC RANK
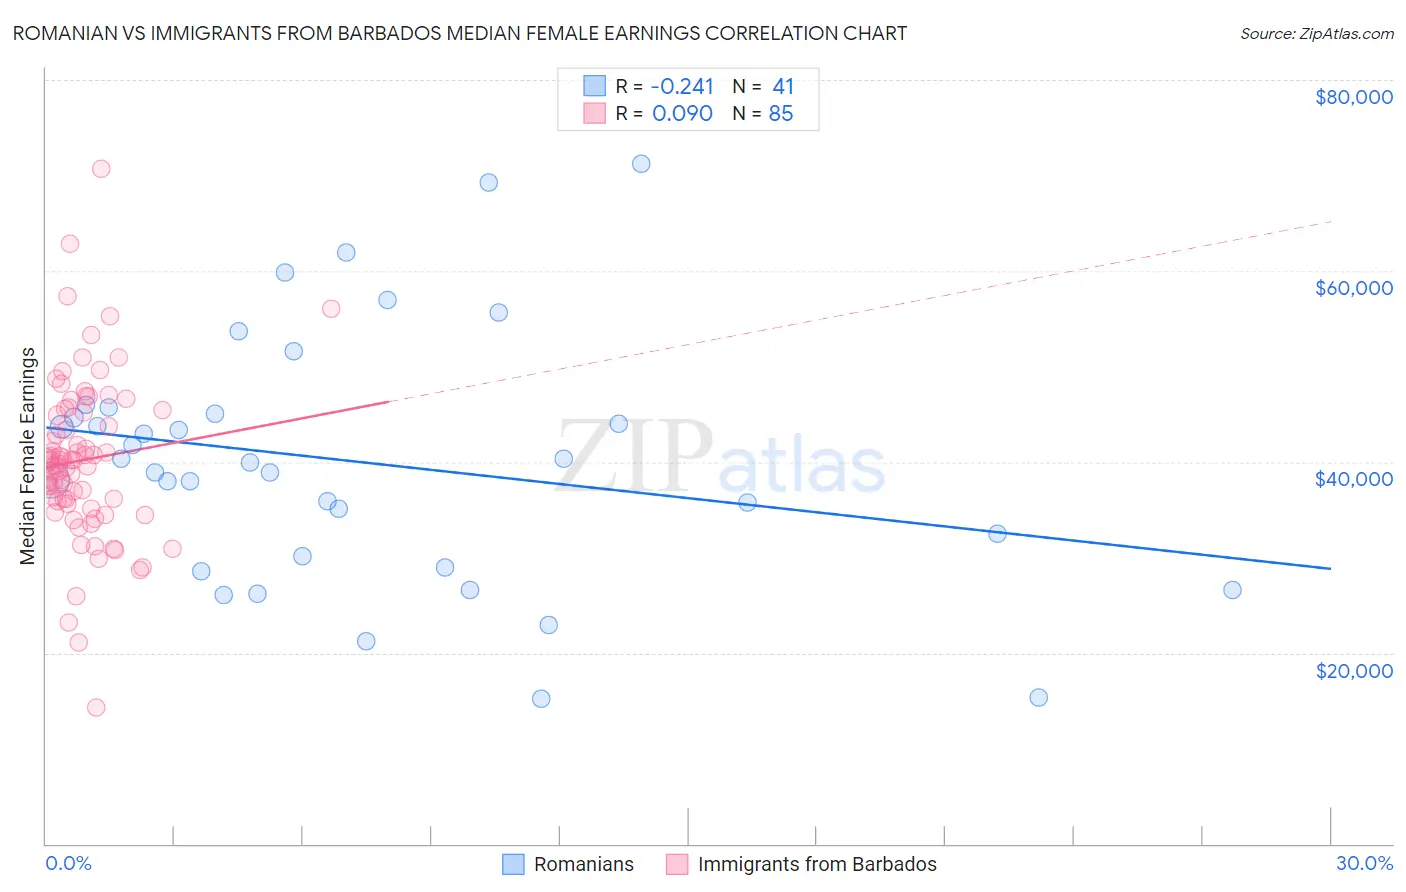
Romanian vs Immigrants from Barbados Median Female Earnings Correlation Chart
The statistical analysis conducted on geographies consisting of 377,764,686 people shows a weak negative correlation between the proportion of Romanians and median female earnings in the United States with a correlation coefficient (R) of -0.241 and weighted average of $41,663. Similarly, the statistical analysis conducted on geographies consisting of 112,771,231 people shows a slight positive correlation between the proportion of Immigrants from Barbados and median female earnings in the United States with a correlation coefficient (R) of 0.090 and weighted average of $41,685, a difference of 0.050%.
Median Female Earnings Correlation Summary
| Measurement | Romanian | Immigrants from Barbados |
| Minimum | $15,248 | $14,324 |
| Maximum | $71,250 | $70,712 |
| Range | $56,002 | $56,388 |
| Mean | $39,999 | $40,171 |
| Median | $39,890 | $40,011 |
| Interquartile 25% (IQ1) | $29,536 | $35,731 |
| Interquartile 75% (IQ3) | $45,366 | $45,302 |
| Interquartile Range (IQR) | $15,830 | $9,570 |
| Standard Deviation (Sample) | $13,074 | $8,566 |
| Standard Deviation (Population) | $12,914 | $8,515 |
Demographics Similar to Romanians and Immigrants from Barbados by Median Female Earnings
In terms of median female earnings, the demographic groups most similar to Romanians are Immigrants from Fiji ($41,656, a difference of 0.020%), Immigrants from Poland ($41,630, a difference of 0.080%), Immigrants from Scotland ($41,771, a difference of 0.26%), Immigrants from Argentina ($41,554, a difference of 0.26%), and Immigrants from Zimbabwe ($41,527, a difference of 0.33%). Similarly, the demographic groups most similar to Immigrants from Barbados are Immigrants from Fiji ($41,656, a difference of 0.070%), Immigrants from Poland ($41,630, a difference of 0.13%), Immigrants from Scotland ($41,771, a difference of 0.21%), Immigrants from Argentina ($41,554, a difference of 0.31%), and Immigrants from Hungary ($41,820, a difference of 0.32%).
| Demographics | Rating | Rank | Median Female Earnings |
| Immigrants | Afghanistan | 99.3 /100 | #89 | Exceptional $42,055 |
| Ukrainians | 99.2 /100 | #90 | Exceptional $42,015 |
| Immigrants | Western Europe | 99.2 /100 | #91 | Exceptional $41,990 |
| Argentineans | 99.1 /100 | #92 | Exceptional $41,952 |
| Immigrants | Grenada | 99.0 /100 | #93 | Exceptional $41,932 |
| Moroccans | 98.9 /100 | #94 | Exceptional $41,872 |
| Immigrants | Netherlands | 98.9 /100 | #95 | Exceptional $41,870 |
| South Africans | 98.8 /100 | #96 | Exceptional $41,825 |
| Immigrants | Hungary | 98.8 /100 | #97 | Exceptional $41,820 |
| Immigrants | Scotland | 98.7 /100 | #98 | Exceptional $41,771 |
| Immigrants | Barbados | 98.4 /100 | #99 | Exceptional $41,685 |
| Romanians | 98.3 /100 | #100 | Exceptional $41,663 |
| Immigrants | Fiji | 98.3 /100 | #101 | Exceptional $41,656 |
| Immigrants | Poland | 98.2 /100 | #102 | Exceptional $41,630 |
| Immigrants | Argentina | 97.9 /100 | #103 | Exceptional $41,554 |
| Immigrants | Zimbabwe | 97.8 /100 | #104 | Exceptional $41,527 |
| Italians | 97.7 /100 | #105 | Exceptional $41,505 |
| Immigrants | Eritrea | 97.6 /100 | #106 | Exceptional $41,485 |
| Palestinians | 97.6 /100 | #107 | Exceptional $41,484 |
| Jordanians | 97.5 /100 | #108 | Exceptional $41,464 |
| Chinese | 97.5 /100 | #109 | Exceptional $41,461 |