Puerto Rican vs Immigrants from Barbados Householder Income Under 25 years
COMPARE
Puerto Rican
Immigrants from Barbados
Householder Income Under 25 years
Householder Income Under 25 years Comparison
Puerto Ricans
Immigrants from Barbados
$39,726
HOUSEHOLDER INCOME UNDER 25 YEARS
0.0/ 100
METRIC RATING
346th/ 347
METRIC RANK
$53,163
HOUSEHOLDER INCOME UNDER 25 YEARS
91.5/ 100
METRIC RATING
137th/ 347
METRIC RANK
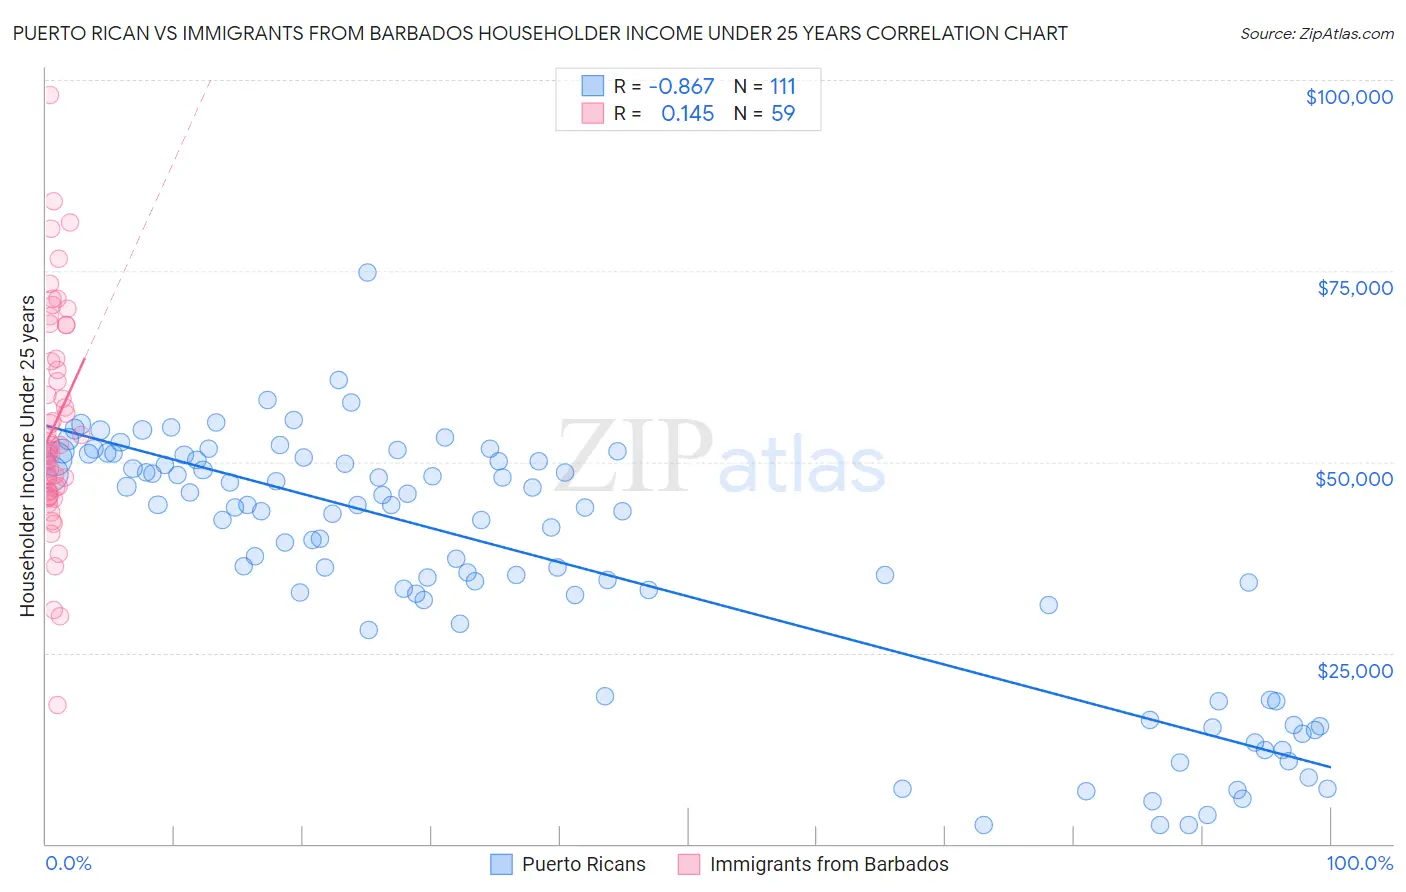
Puerto Rican vs Immigrants from Barbados Householder Income Under 25 years Correlation Chart
The statistical analysis conducted on geographies consisting of 421,445,593 people shows a very strong negative correlation between the proportion of Puerto Ricans and household income with householder under the age of 25 in the United States with a correlation coefficient (R) of -0.867 and weighted average of $39,726. Similarly, the statistical analysis conducted on geographies consisting of 102,730,809 people shows a poor positive correlation between the proportion of Immigrants from Barbados and household income with householder under the age of 25 in the United States with a correlation coefficient (R) of 0.145 and weighted average of $53,163, a difference of 33.8%.
Householder Income Under 25 years Correlation Summary
| Measurement | Puerto Rican | Immigrants from Barbados |
| Minimum | $2,499 | $18,183 |
| Maximum | $74,844 | $98,041 |
| Range | $72,345 | $79,858 |
| Mean | $37,468 | $54,788 |
| Median | $43,546 | $51,763 |
| Interquartile 25% (IQ1) | $28,872 | $46,030 |
| Interquartile 75% (IQ3) | $50,281 | $63,444 |
| Interquartile Range (IQR) | $21,410 | $17,414 |
| Standard Deviation (Sample) | $16,633 | $14,303 |
| Standard Deviation (Population) | $16,558 | $14,181 |
Similar Demographics by Householder Income Under 25 years
Demographics Similar to Puerto Ricans by Householder Income Under 25 years
In terms of householder income under 25 years, the demographic groups most similar to Puerto Ricans are Navajo ($42,380, a difference of 6.7%), Immigrants from Congo ($43,266, a difference of 8.9%), Immigrants from Yemen ($43,591, a difference of 9.7%), Arapaho ($44,003, a difference of 10.8%), and Houma ($44,356, a difference of 11.7%).
| Demographics | Rating | Rank | Householder Income Under 25 years |
| Creek | 0.0 /100 | #333 | Tragic $45,371 |
| Cajuns | 0.0 /100 | #334 | Tragic $45,338 |
| Cheyenne | 0.0 /100 | #335 | Tragic $45,275 |
| Tohono O'odham | 0.0 /100 | #336 | Tragic $45,248 |
| Pueblo | 0.0 /100 | #337 | Tragic $45,018 |
| Chickasaw | 0.0 /100 | #338 | Tragic $44,763 |
| Kiowa | 0.0 /100 | #339 | Tragic $44,733 |
| Blacks/African Americans | 0.0 /100 | #340 | Tragic $44,381 |
| Houma | 0.0 /100 | #341 | Tragic $44,356 |
| Arapaho | 0.0 /100 | #342 | Tragic $44,003 |
| Immigrants | Yemen | 0.0 /100 | #343 | Tragic $43,591 |
| Immigrants | Congo | 0.0 /100 | #344 | Tragic $43,266 |
| Navajo | 0.0 /100 | #345 | Tragic $42,380 |
| Puerto Ricans | 0.0 /100 | #346 | Tragic $39,726 |
| Lumbee | 0.0 /100 | #347 | Tragic $34,584 |
Demographics Similar to Immigrants from Barbados by Householder Income Under 25 years
In terms of householder income under 25 years, the demographic groups most similar to Immigrants from Barbados are Armenian ($53,179, a difference of 0.030%), Immigrants from Northern Africa ($53,185, a difference of 0.040%), Chilean ($53,185, a difference of 0.040%), Immigrants ($53,201, a difference of 0.070%), and Norwegian ($53,127, a difference of 0.070%).
| Demographics | Rating | Rank | Householder Income Under 25 years |
| Nicaraguans | 93.4 /100 | #130 | Exceptional $53,275 |
| Immigrants | Nicaragua | 93.3 /100 | #131 | Exceptional $53,266 |
| Moroccans | 93.1 /100 | #132 | Exceptional $53,256 |
| Immigrants | Immigrants | 92.2 /100 | #133 | Exceptional $53,201 |
| Immigrants | Northern Africa | 91.9 /100 | #134 | Exceptional $53,185 |
| Chileans | 91.9 /100 | #135 | Exceptional $53,185 |
| Armenians | 91.8 /100 | #136 | Exceptional $53,179 |
| Immigrants | Barbados | 91.5 /100 | #137 | Exceptional $53,163 |
| Norwegians | 90.8 /100 | #138 | Exceptional $53,127 |
| Costa Ricans | 90.4 /100 | #139 | Exceptional $53,106 |
| Hawaiians | 89.8 /100 | #140 | Excellent $53,078 |
| Danes | 88.9 /100 | #141 | Excellent $53,041 |
| Immigrants | Armenia | 87.5 /100 | #142 | Excellent $52,986 |
| Swedes | 87.5 /100 | #143 | Excellent $52,986 |
| South American Indians | 87.3 /100 | #144 | Excellent $52,979 |