Pueblo vs Sudanese Median Earnings
COMPARE
Pueblo
Sudanese
Median Earnings
Median Earnings Comparison
Pueblo
Sudanese
$36,859
MEDIAN EARNINGS
0.0/ 100
METRIC RATING
343rd/ 347
METRIC RANK
$44,419
MEDIAN EARNINGS
5.6/ 100
METRIC RATING
238th/ 347
METRIC RANK
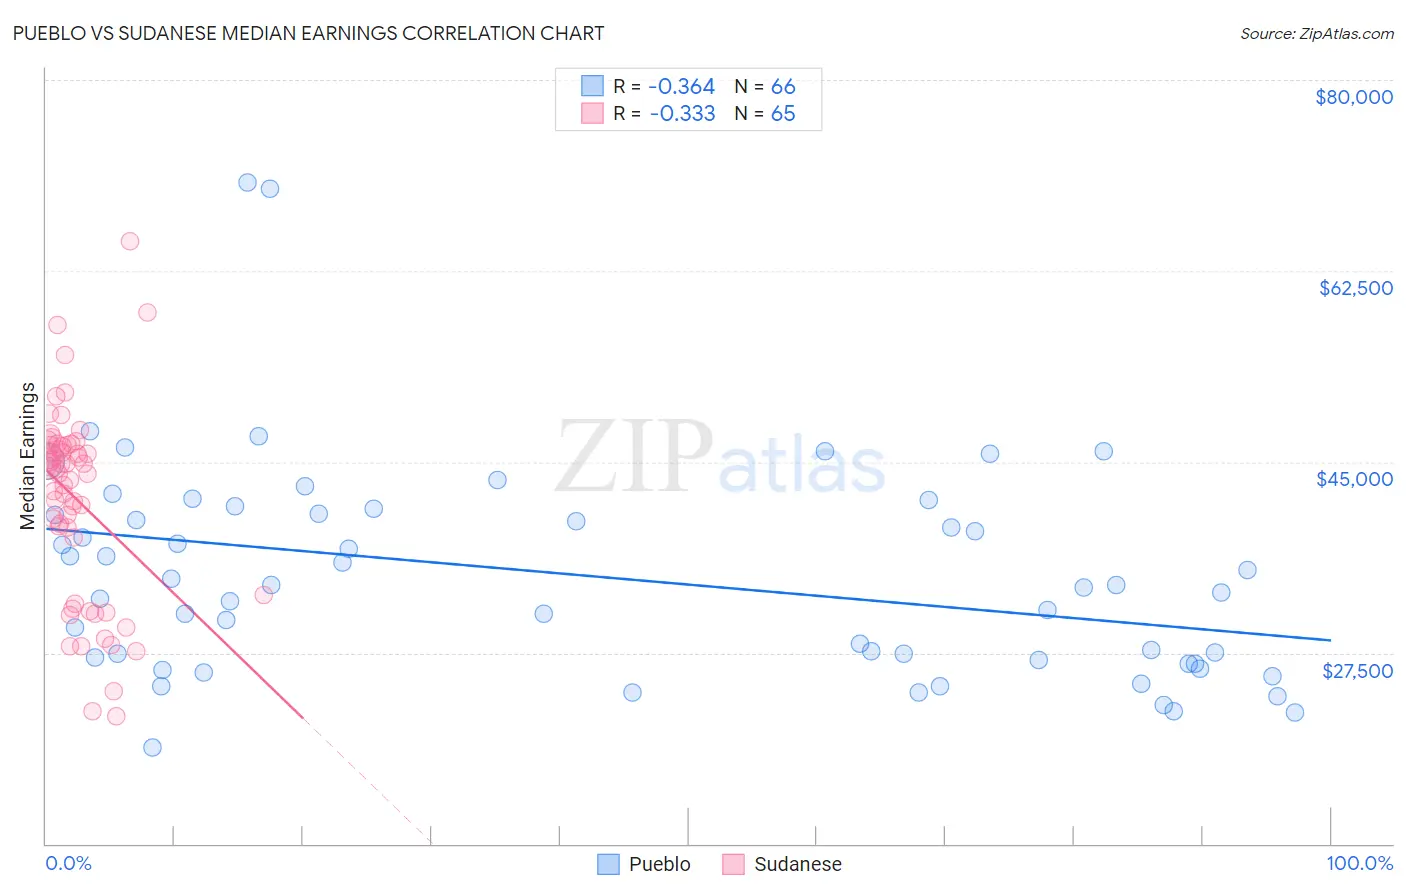
Pueblo vs Sudanese Median Earnings Correlation Chart
The statistical analysis conducted on geographies consisting of 120,073,661 people shows a mild negative correlation between the proportion of Pueblo and median earnings in the United States with a correlation coefficient (R) of -0.364 and weighted average of $36,859. Similarly, the statistical analysis conducted on geographies consisting of 110,129,376 people shows a mild negative correlation between the proportion of Sudanese and median earnings in the United States with a correlation coefficient (R) of -0.333 and weighted average of $44,419, a difference of 20.5%.
Median Earnings Correlation Summary
| Measurement | Pueblo | Sudanese |
| Minimum | $18,846 | $21,638 |
| Maximum | $70,625 | $65,192 |
| Range | $51,779 | $43,554 |
| Mean | $34,570 | $41,590 |
| Median | $33,598 | $44,417 |
| Interquartile 25% (IQ1) | $26,791 | $35,456 |
| Interquartile 75% (IQ3) | $40,227 | $46,591 |
| Interquartile Range (IQR) | $13,436 | $11,136 |
| Standard Deviation (Sample) | $9,914 | $8,811 |
| Standard Deviation (Population) | $9,839 | $8,743 |
Similar Demographics by Median Earnings
Demographics Similar to Pueblo by Median Earnings
In terms of median earnings, the demographic groups most similar to Pueblo are Hopi ($36,871, a difference of 0.030%), Lumbee ($36,876, a difference of 0.050%), Navajo ($36,999, a difference of 0.38%), Arapaho ($36,586, a difference of 0.75%), and Tohono O'odham ($36,349, a difference of 1.4%).
| Demographics | Rating | Rank | Median Earnings |
| Houma | 0.0 /100 | #333 | Tragic $38,949 |
| Spanish American Indians | 0.0 /100 | #334 | Tragic $38,907 |
| Natives/Alaskans | 0.0 /100 | #335 | Tragic $38,896 |
| Crow | 0.0 /100 | #336 | Tragic $38,707 |
| Immigrants | Cuba | 0.0 /100 | #337 | Tragic $38,426 |
| Pima | 0.0 /100 | #338 | Tragic $38,285 |
| Menominee | 0.0 /100 | #339 | Tragic $37,884 |
| Navajo | 0.0 /100 | #340 | Tragic $36,999 |
| Lumbee | 0.0 /100 | #341 | Tragic $36,876 |
| Hopi | 0.0 /100 | #342 | Tragic $36,871 |
| Pueblo | 0.0 /100 | #343 | Tragic $36,859 |
| Arapaho | 0.0 /100 | #344 | Tragic $36,586 |
| Tohono O'odham | 0.0 /100 | #345 | Tragic $36,349 |
| Yup'ik | 0.0 /100 | #346 | Tragic $35,942 |
| Puerto Ricans | 0.0 /100 | #347 | Tragic $35,560 |
Demographics Similar to Sudanese by Median Earnings
In terms of median earnings, the demographic groups most similar to Sudanese are Immigrants from Ecuador ($44,462, a difference of 0.10%), Senegalese ($44,373, a difference of 0.10%), British West Indian ($44,552, a difference of 0.30%), Venezuelan ($44,580, a difference of 0.36%), and Aleut ($44,241, a difference of 0.40%).
| Demographics | Rating | Rank | Median Earnings |
| Japanese | 9.5 /100 | #231 | Tragic $44,825 |
| Delaware | 9.0 /100 | #232 | Tragic $44,783 |
| Immigrants | Sudan | 8.8 /100 | #233 | Tragic $44,767 |
| Cape Verdeans | 7.5 /100 | #234 | Tragic $44,640 |
| Venezuelans | 6.9 /100 | #235 | Tragic $44,580 |
| British West Indians | 6.7 /100 | #236 | Tragic $44,552 |
| Immigrants | Ecuador | 5.9 /100 | #237 | Tragic $44,462 |
| Sudanese | 5.6 /100 | #238 | Tragic $44,419 |
| Senegalese | 5.3 /100 | #239 | Tragic $44,373 |
| Aleuts | 4.4 /100 | #240 | Tragic $44,241 |
| Samoans | 4.2 /100 | #241 | Tragic $44,206 |
| Immigrants | Venezuela | 4.0 /100 | #242 | Tragic $44,163 |
| Sub-Saharan Africans | 3.7 /100 | #243 | Tragic $44,118 |
| Immigrants | Nonimmigrants | 3.7 /100 | #244 | Tragic $44,117 |
| Immigrants | Burma/Myanmar | 3.2 /100 | #245 | Tragic $43,998 |