Pueblo vs Immigrants from Armenia Householder Income Ages 25 - 44 years

COMPARE

Pueblo
Race
Ancestry
AfghanAfricanAlaska NativeAlaskan AthabascanAlbanianAleutAlsatianAmericanApacheArabArapahoArgentineanArmenianAssyrian/Chaldean/SyriacAustralianAustrianBahamianBangladeshiBarbadianBasqueBelgianBelizeanBermudanBhutaneseBlackfeetBolivianBrazilianBritishBritish West IndianBulgarianBurmeseCajunCambodianCanadianCape VerdeanCarpatho RusynCelticCentral AmericanCentral American IndianCherokeeCheyenneChickasawChileanChineseChippewaChoctawColombianColvilleComancheCosta RicanCreeCreekCroatianCrowCubanCypriotCzechCzechoslovakianDanishDelawareDominicanDutchDutch West IndianEastern EuropeanEcuadorianEgyptianEnglishEstonianEthiopianEuropeanFijianFilipinoFinnishFrenchFrench American IndianFrench CanadianGermanGerman RussianGhanaianGreekGuamanian/ChamorroGuatemalanGuyaneseHaitianHmongHonduranHopiHoumaHungarianIcelanderIndian (Asian)IndonesianInupiatIranianIraqiIrishIroquoisIsraeliItalianJamaicanJapaneseJordanianKenyanKiowaKoreanLaotianLatvianLebaneseLiberianLithuanianLumbeeLuxembourgerMacedonianMalaysianMalteseMarshalleseMenomineeMexicanMexican American IndianMongolianMoroccanNative HawaiianNavajoNepaleseNew ZealanderNicaraguanNigerianNorthern EuropeanNorwegianOkinawanOsageOttawaPaiutePakistaniPalestinianPanamanianParaguayanPennsylvania GermanPeruvianPimaPolishPortuguesePotawatomiPuebloPuerto RicanPuget Sound SalishRomanianRussianSalvadoranSamoanScandinavianScotch-IrishScottishSeminoleSenegaleseSerbianShoshoneSierra LeoneanSiouxSlavicSlovakSloveneSomaliSouth AfricanSouth AmericanSouth American IndianSoviet UnionSpaniardSpanishSpanish AmericanSpanish American IndianSri LankanSubsaharan AfricanSudaneseSwedishSwissSyrianTaiwaneseThaiTlingit-HaidaTohono O'OdhamTonganTrinidadian and TobagonianTsimshianTurkishU.S. Virgin IslanderUgandanUkrainianUruguayanUteVenezuelanVietnameseWelshWest IndianYakamaYaquiYugoslavianYumanYup'ikZimbabwean
Immigration
NonimmigrantsImmigrantsAfghanistanAfricaAlbaniaArgentinaAsiaAustraliaAustriaBahamasBangladeshBarbadosBelarusBelgiumBelizeBoliviaBosnia and HerzegovinaBrazilBulgariaBurma/MyanmarCabo VerdeCambodiaCameroonCanadaCaribbeanCentral AmericaChileChinaColombiaCongoCosta RicaCroatiaCubaCzechoslovakiaDenmarkDominicaDominican RepublicEastern AfricaEastern AsiaEastern EuropeEcuadorEgyptEl SalvadorEnglandEritreaEthiopiaEuropeFijiFranceGermanyGhanaGreeceGrenadaGuatemalaGuyanaHaitiHondurasHong KongHungaryIndiaIndonesiaIranIraqIrelandIsraelItalyJamaicaJapanJordanKazakhstanKenyaKoreaKuwaitLaosLatin AmericaLatviaLebanonLiberiaLithuaniaMalaysiaMexicoMicronesiaMiddle AfricaMoldovaMoroccoNepalNetherlandsNicaraguaNigeriaNorth AmericaNorth MacedoniaNorthern AfricaNorthern EuropeNorwayOceaniaPakistanPanamaPeruPhilippinesPolandPortugalRomaniaRussiaSaudi ArabiaScotlandSenegalSerbiaSierra LeoneSingaporeSomaliaSouth AfricaSouth AmericaSouth Central AsiaSouth Eastern AsiaSouthern EuropeSpainSri LankaSt. Vincent and the GrenadinesSudanSwedenSwitzerlandSyriaTaiwanThailandTrinidad and TobagoTurkeyUgandaUkraineUruguayUzbekistanVenezuelaVietnamWest IndiesWestern AfricaWestern AsiaWestern EuropeYemenZaireZimbabweAzores
Immigrants from Armenia
Race
Ancestry
AfghanAfricanAlaska NativeAlaskan AthabascanAlbanianAleutAlsatianAmericanApacheArabArapahoArgentineanArmenianAssyrian/Chaldean/SyriacAustralianAustrianBahamianBangladeshiBarbadianBasqueBelgianBelizeanBermudanBhutaneseBlackfeetBolivianBrazilianBritishBritish West IndianBulgarianBurmeseCajunCambodianCanadianCape VerdeanCarpatho RusynCelticCentral AmericanCentral American IndianCherokeeCheyenneChickasawChileanChineseChippewaChoctawColombianColvilleComancheCosta RicanCreeCreekCroatianCrowCubanCypriotCzechCzechoslovakianDanishDelawareDominicanDutchDutch West IndianEastern EuropeanEcuadorianEgyptianEnglishEstonianEthiopianEuropeanFijianFilipinoFinnishFrenchFrench American IndianFrench CanadianGermanGerman RussianGhanaianGreekGuamanian/ChamorroGuatemalanGuyaneseHaitianHmongHonduranHopiHoumaHungarianIcelanderIndian (Asian)IndonesianInupiatIranianIraqiIrishIroquoisIsraeliItalianJamaicanJapaneseJordanianKenyanKiowaKoreanLaotianLatvianLebaneseLiberianLithuanianLumbeeLuxembourgerMacedonianMalaysianMalteseMarshalleseMenomineeMexicanMexican American IndianMongolianMoroccanNative HawaiianNavajoNepaleseNew ZealanderNicaraguanNigerianNorthern EuropeanNorwegianOkinawanOsageOttawaPaiutePakistaniPalestinianPanamanianParaguayanPennsylvania GermanPeruvianPimaPolishPortuguesePotawatomiPuerto RicanPuget Sound SalishRomanianRussianSalvadoranSamoanScandinavianScotch-IrishScottishSeminoleSenegaleseSerbianShoshoneSierra LeoneanSiouxSlavicSlovakSloveneSomaliSouth AfricanSouth AmericanSouth American IndianSoviet UnionSpaniardSpanishSpanish AmericanSpanish American IndianSri LankanSubsaharan AfricanSudaneseSwedishSwissSyrianTaiwaneseThaiTlingit-HaidaTohono O'OdhamTonganTrinidadian and TobagonianTsimshianTurkishU.S. Virgin IslanderUgandanUkrainianUruguayanUteVenezuelanVietnameseWelshWest IndianYakamaYaquiYugoslavianYumanYup'ikZimbabwean
Immigration
NonimmigrantsImmigrantsAfghanistanAfricaAlbaniaArgentinaArmeniaAsiaAustraliaAustriaBahamasBangladeshBarbadosBelarusBelgiumBelizeBoliviaBosnia and HerzegovinaBrazilBulgariaBurma/MyanmarCabo VerdeCambodiaCameroonCanadaCaribbeanCentral AmericaChileChinaColombiaCongoCosta RicaCroatiaCubaCzechoslovakiaDenmarkDominicaDominican RepublicEastern AfricaEastern AsiaEastern EuropeEcuadorEgyptEl SalvadorEnglandEritreaEthiopiaEuropeFijiFranceGermanyGhanaGreeceGrenadaGuatemalaGuyanaHaitiHondurasHong KongHungaryIndiaIndonesiaIranIraqIrelandIsraelItalyJamaicaJapanJordanKazakhstanKenyaKoreaKuwaitLaosLatin AmericaLatviaLebanonLiberiaLithuaniaMalaysiaMexicoMicronesiaMiddle AfricaMoldovaMoroccoNepalNetherlandsNicaraguaNigeriaNorth AmericaNorth MacedoniaNorthern AfricaNorthern EuropeNorwayOceaniaPakistanPanamaPeruPhilippinesPolandPortugalRomaniaRussiaSaudi ArabiaScotlandSenegalSerbiaSierra LeoneSingaporeSomaliaSouth AfricaSouth AmericaSouth Central AsiaSouth Eastern AsiaSouthern EuropeSpainSri LankaSt. Vincent and the GrenadinesSudanSwedenSwitzerlandSyriaTaiwanThailandTrinidad and TobagoTurkeyUgandaUkraineUruguayUzbekistanVenezuelaVietnamWest IndiesWestern AfricaWestern AsiaWestern EuropeYemenZaireZimbabweAzores
Householder Income Ages 25 - 44 years
Income
Poverty
Unemployment
Labor Participation
Family Structure
Vehicle Availability
Education Level
Disability

Householder Income Ages 25 - 44 years Comparison

Pueblo

Immigrants from Armenia

Tragic
Average
$68,910
HOUSEHOLDER INCOME AGES 25 - 44 YEARS
0.0/ 100
METRIC RATING
344th/ 347
METRIC RANK
$94,867
HOUSEHOLDER INCOME AGES 25 - 44 YEARS
54.2/ 100
METRIC RATING
171st/ 347
METRIC RANK

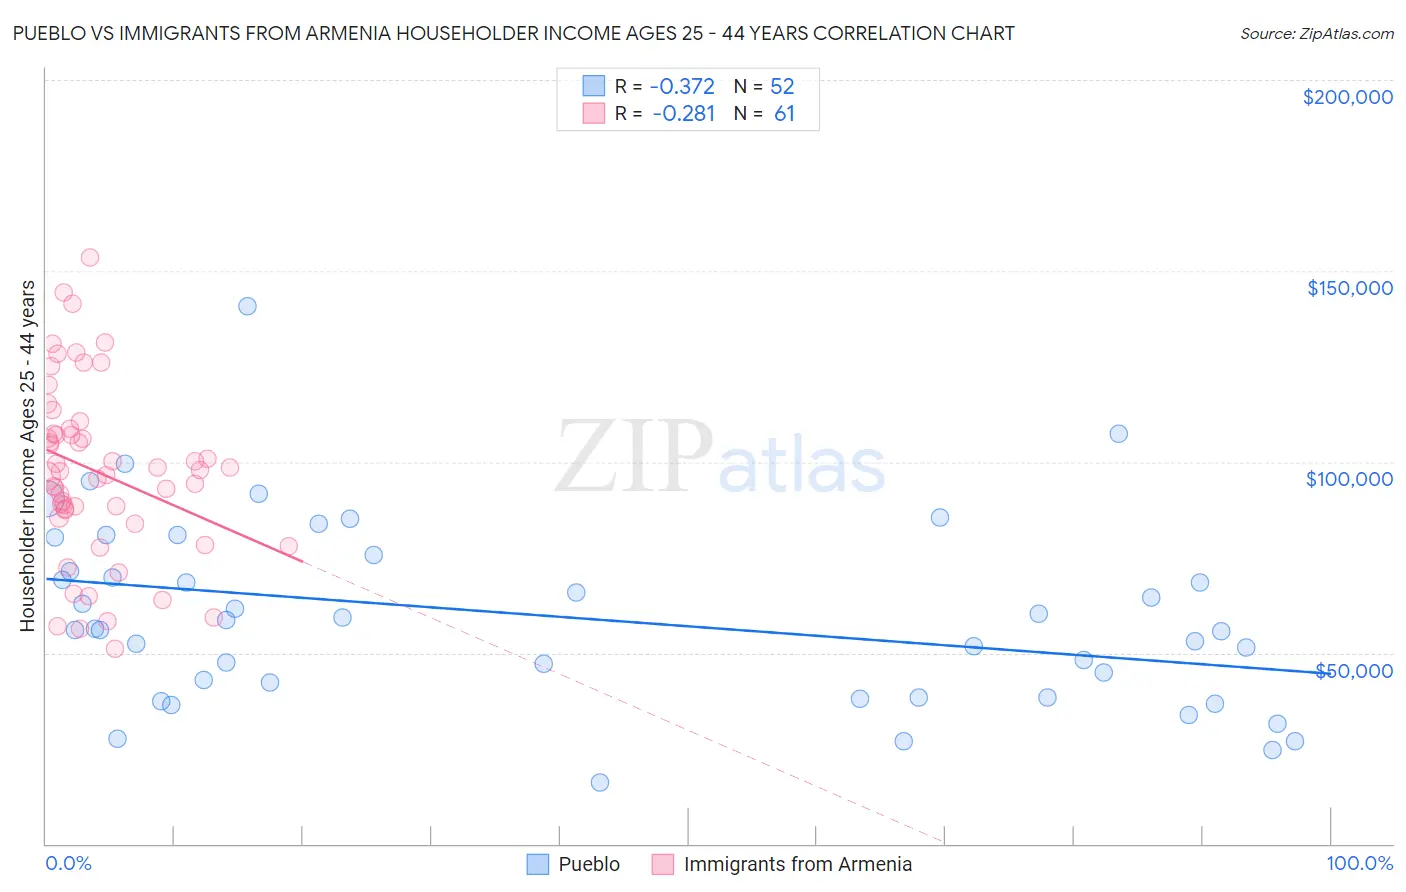
Pueblo vs Immigrants from Armenia Householder Income Ages 25 - 44 years Correlation Chart

The statistical analysis conducted on geographies consisting of 119,922,511 people shows a mild negative correlation between the proportion of Pueblo and household income with householder between the ages 25 and 44 in the United States with a correlation coefficient (R) of -0.372 and weighted average of $68,910. Similarly, the statistical analysis conducted on geographies consisting of 97,704,763 people shows a weak negative correlation between the proportion of Immigrants from Armenia and household income with householder between the ages 25 and 44 in the United States with a correlation coefficient (R) of -0.281 and weighted average of $94,867, a difference of 37.7%.
Pueblo vs Immigrants from Armenia Householder Income Ages 25 - 44 years

Householder Income Ages 25 - 44 years Correlation Summary

MeasurementPuebloImmigrants from Armenia
Minimum$16,125$50,938
Maximum$140,852$153,486
Range$124,727$102,548
Mean$59,480$97,387
Median$56,103$97,643
Interquartile 25% (IQ1)$40,297$86,360
Interquartile 75% (IQ3)$73,434$108,002
Interquartile Range (IQR)$33,137$21,642
Standard Deviation (Sample)$24,239$22,751
Standard Deviation (Population)$24,005$22,564

Similar Demographics by Householder Income Ages 25 - 44 years

Demographics Similar to Pueblo by Householder Income Ages 25 - 44 years

In terms of householder income ages 25 - 44 years, the demographic groups most similar to Pueblo are Tohono O'odham ($69,068, a difference of 0.23%), Crow ($71,337, a difference of 3.5%), Navajo ($66,529, a difference of 3.6%), Arapaho ($71,697, a difference of 4.0%), and Puerto Rican ($65,996, a difference of 4.4%).
DemographicsRating | RankHouseholder Income Ages 25 - 44 years
Hopi
0.0
/100
|
#333
Tragic
$75,002
Creek
0.0
/100
|
#334
Tragic
$74,847
Kiowa
0.0
/100
|
#335
Tragic
$74,776
Yup'ik
0.0
/100
|
#336
Tragic
$73,688
Blacks/African Americans
0.0
/100
|
#337
Tragic
$73,370
Immigrants | Yemen
0.0
/100
|
#338
Tragic
$73,043
Yuman
0.0
/100
|
#339
Tragic
$72,956
Immigrants | Congo
0.0
/100
|
#340
Tragic
$72,178
Arapaho
0.0
/100
|
#341
Tragic
$71,697
Crow
0.0
/100
|
#342
Tragic
$71,337
Tohono O'odham
0.0
/100
|
#343
Tragic
$69,068
Pueblo
0.0
/100
|
#344
Tragic
$68,910
Navajo
0.0
/100
|
#345
Tragic
$66,529
Puerto Ricans
0.0
/100
|
#346
Tragic
$65,996
Lumbee
0.0
/100
|
#347
Tragic
$60,305

Demographics Similar to Immigrants from Armenia by Householder Income Ages 25 - 44 years

In terms of householder income ages 25 - 44 years, the demographic groups most similar to Immigrants from Armenia are Slovak ($95,032, a difference of 0.17%), Alsatian ($95,059, a difference of 0.20%), Native Hawaiian ($95,058, a difference of 0.20%), Czechoslovakian ($95,070, a difference of 0.21%), and Scottish ($94,622, a difference of 0.26%).
DemographicsRating | RankHouseholder Income Ages 25 - 44 years
South Americans
60.9
/100
|
#164
Good
$95,362
Immigrants | Nepal
60.3
/100
|
#165
Good
$95,322
Immigrants | Ethiopia
59.5
/100
|
#166
Average
$95,256
Czechoslovakians
57.0
/100
|
#167
Average
$95,070
Alsatians
56.8
/100
|
#168
Average
$95,059
Native Hawaiians
56.8
/100
|
#169
Average
$95,058
Slovaks
56.4
/100
|
#170
Average
$95,032
Immigrants | Armenia
54.2
/100
|
#171
Average
$94,867
Scottish
50.8
/100
|
#172
Average
$94,622
Finns
50.6
/100
|
#173
Average
$94,610
Colombians
50.0
/100
|
#174
Average
$94,565
English
48.1
/100
|
#175
Average
$94,429
Immigrants | Immigrants
48.0
/100
|
#176
Average
$94,423
Belgians
45.8
/100
|
#177
Average
$94,262
Immigrants | South America
42.8
/100
|
#178
Average
$94,042