Pueblo vs Bhutanese Median Family Income
COMPARE
Pueblo
Bhutanese
Median Family Income
Median Family Income Comparison
Pueblo
Bhutanese
$76,880
MEDIAN FAMILY INCOME
0.0/ 100
METRIC RATING
341st/ 347
METRIC RANK
$119,800
MEDIAN FAMILY INCOME
100.0/ 100
METRIC RATING
33rd/ 347
METRIC RANK
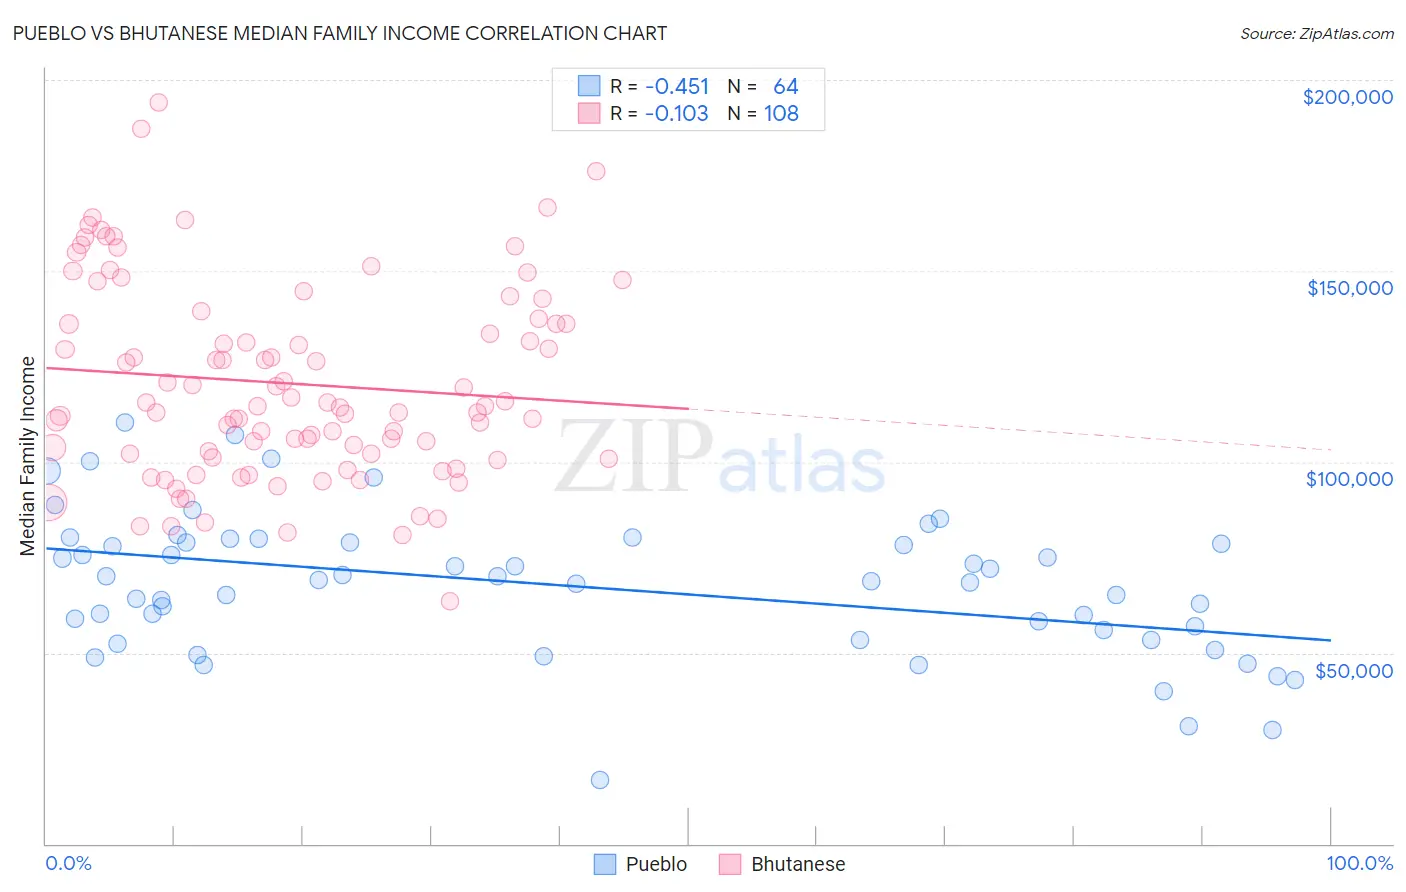
Pueblo vs Bhutanese Median Family Income Correlation Chart
The statistical analysis conducted on geographies consisting of 120,047,767 people shows a moderate negative correlation between the proportion of Pueblo and median family income in the United States with a correlation coefficient (R) of -0.451 and weighted average of $76,880. Similarly, the statistical analysis conducted on geographies consisting of 454,953,353 people shows a poor negative correlation between the proportion of Bhutanese and median family income in the United States with a correlation coefficient (R) of -0.103 and weighted average of $119,800, a difference of 55.8%.
Median Family Income Correlation Summary
| Measurement | Pueblo | Bhutanese |
| Minimum | $16,806 | $63,382 |
| Maximum | $110,375 | $194,165 |
| Range | $93,569 | $130,783 |
| Mean | $67,508 | $120,532 |
| Median | $68,832 | $114,614 |
| Interquartile 25% (IQ1) | $54,583 | $101,662 |
| Interquartile 75% (IQ3) | $78,820 | $136,845 |
| Interquartile Range (IQR) | $24,237 | $35,183 |
| Standard Deviation (Sample) | $18,534 | $25,704 |
| Standard Deviation (Population) | $18,389 | $25,585 |
Similar Demographics by Median Family Income
Demographics Similar to Pueblo by Median Family Income
In terms of median family income, the demographic groups most similar to Pueblo are Crow ($76,605, a difference of 0.36%), Hopi ($77,188, a difference of 0.40%), Pima ($77,431, a difference of 0.72%), Immigrants from Yemen ($77,457, a difference of 0.75%), and Houma ($76,188, a difference of 0.91%).
| Demographics | Rating | Rank | Median Family Income |
| Kiowa | 0.0 /100 | #333 | Tragic $80,885 |
| Menominee | 0.0 /100 | #334 | Tragic $79,563 |
| Yup'ik | 0.0 /100 | #335 | Tragic $79,290 |
| Immigrants | Cuba | 0.0 /100 | #336 | Tragic $78,249 |
| Yuman | 0.0 /100 | #337 | Tragic $78,055 |
| Immigrants | Yemen | 0.0 /100 | #338 | Tragic $77,457 |
| Pima | 0.0 /100 | #339 | Tragic $77,431 |
| Hopi | 0.0 /100 | #340 | Tragic $77,188 |
| Pueblo | 0.0 /100 | #341 | Tragic $76,880 |
| Crow | 0.0 /100 | #342 | Tragic $76,605 |
| Houma | 0.0 /100 | #343 | Tragic $76,188 |
| Tohono O'odham | 0.0 /100 | #344 | Tragic $72,193 |
| Navajo | 0.0 /100 | #345 | Tragic $70,989 |
| Puerto Ricans | 0.0 /100 | #346 | Tragic $70,423 |
| Lumbee | 0.0 /100 | #347 | Tragic $68,679 |
Demographics Similar to Bhutanese by Median Family Income
In terms of median family income, the demographic groups most similar to Bhutanese are Asian ($119,955, a difference of 0.13%), Immigrants from France ($120,076, a difference of 0.23%), Bolivian ($119,479, a difference of 0.27%), Immigrants from Sri Lanka ($120,263, a difference of 0.39%), and Latvian ($120,301, a difference of 0.42%).
| Demographics | Rating | Rank | Median Family Income |
| Immigrants | Switzerland | 100.0 /100 | #26 | Exceptional $120,726 |
| Russians | 100.0 /100 | #27 | Exceptional $120,487 |
| Immigrants | Denmark | 100.0 /100 | #28 | Exceptional $120,445 |
| Latvians | 100.0 /100 | #29 | Exceptional $120,301 |
| Immigrants | Sri Lanka | 100.0 /100 | #30 | Exceptional $120,263 |
| Immigrants | France | 100.0 /100 | #31 | Exceptional $120,076 |
| Asians | 100.0 /100 | #32 | Exceptional $119,955 |
| Bhutanese | 100.0 /100 | #33 | Exceptional $119,800 |
| Bolivians | 100.0 /100 | #34 | Exceptional $119,479 |
| Soviet Union | 100.0 /100 | #35 | Exceptional $119,262 |
| Israelis | 100.0 /100 | #36 | Exceptional $118,577 |
| Australians | 100.0 /100 | #37 | Exceptional $118,440 |
| Immigrants | Turkey | 100.0 /100 | #38 | Exceptional $118,325 |
| Immigrants | Asia | 100.0 /100 | #39 | Exceptional $118,291 |
| Immigrants | Lithuania | 100.0 /100 | #40 | Exceptional $118,053 |