Peruvian vs Immigrants from South Eastern Asia Median Earnings
COMPARE
Peruvian
Immigrants from South Eastern Asia
Median Earnings
Median Earnings Comparison
Peruvians
Immigrants from South Eastern Asia
$47,628
MEDIAN EARNINGS
84.2/ 100
METRIC RATING
150th/ 347
METRIC RANK
$47,671
MEDIAN EARNINGS
85.0/ 100
METRIC RATING
147th/ 347
METRIC RANK
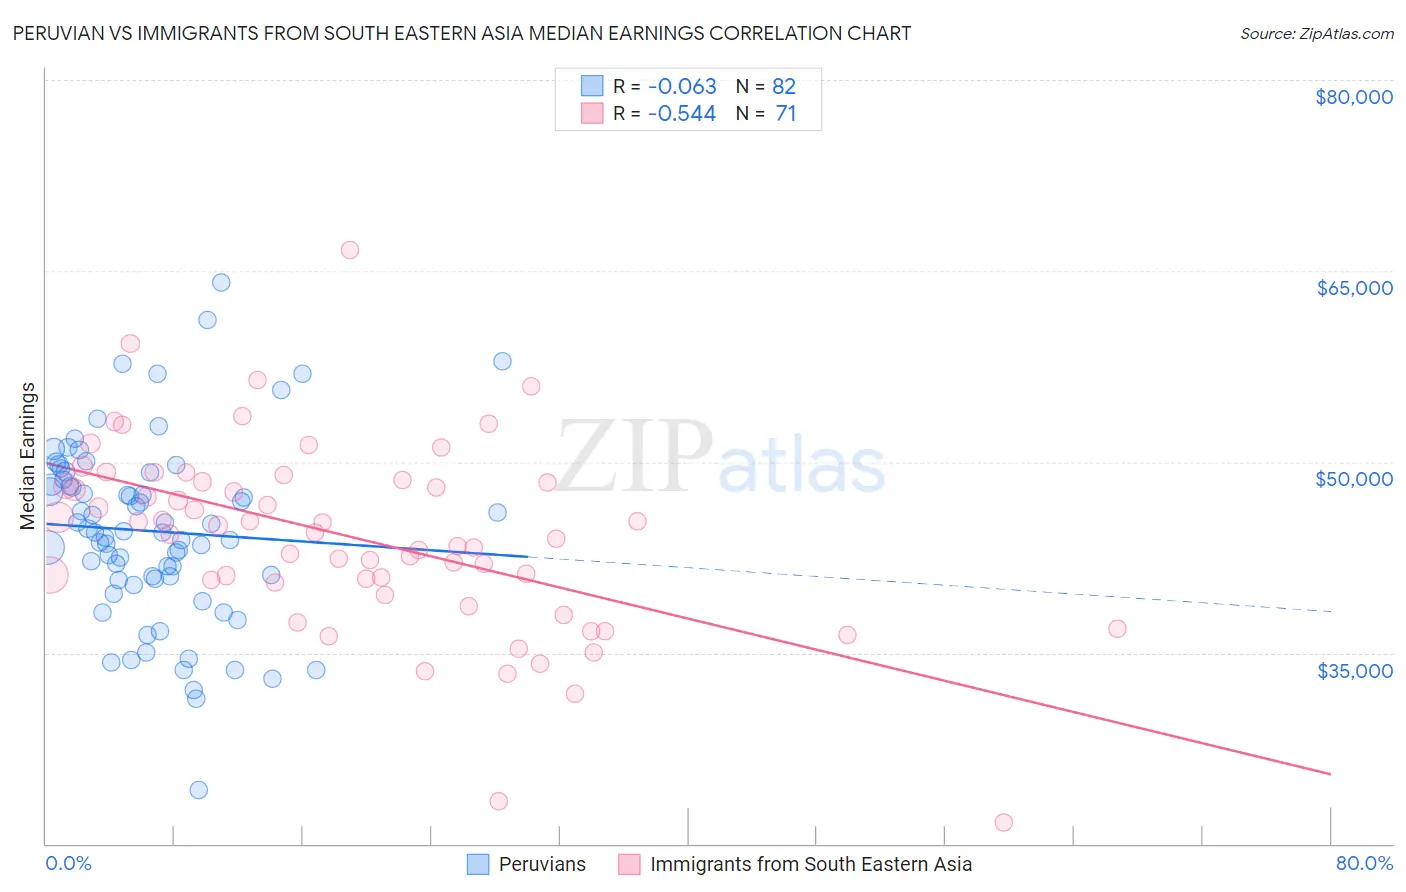
Peruvian vs Immigrants from South Eastern Asia Median Earnings Correlation Chart
The statistical analysis conducted on geographies consisting of 363,247,580 people shows a slight negative correlation between the proportion of Peruvians and median earnings in the United States with a correlation coefficient (R) of -0.063 and weighted average of $47,628. Similarly, the statistical analysis conducted on geographies consisting of 512,554,349 people shows a substantial negative correlation between the proportion of Immigrants from South Eastern Asia and median earnings in the United States with a correlation coefficient (R) of -0.544 and weighted average of $47,671, a difference of 0.090%.
Median Earnings Correlation Summary
| Measurement | Peruvian | Immigrants from South Eastern Asia |
| Minimum | $24,212 | $21,667 |
| Maximum | $64,091 | $66,617 |
| Range | $39,879 | $44,950 |
| Mean | $44,547 | $44,037 |
| Median | $44,525 | $44,467 |
| Interquartile 25% (IQ1) | $40,828 | $40,525 |
| Interquartile 75% (IQ3) | $48,604 | $48,439 |
| Interquartile Range (IQR) | $7,775 | $7,914 |
| Standard Deviation (Sample) | $7,153 | $7,447 |
| Standard Deviation (Population) | $7,110 | $7,395 |
Demographics Similar to Peruvians and Immigrants from South Eastern Asia by Median Earnings
In terms of median earnings, the demographic groups most similar to Peruvians are Luxembourger ($47,640, a difference of 0.020%), Immigrants from Oceania ($47,617, a difference of 0.020%), Immigrants from Eritrea ($47,657, a difference of 0.060%), Immigrants from Germany ($47,566, a difference of 0.13%), and Immigrants from Chile ($47,697, a difference of 0.15%). Similarly, the demographic groups most similar to Immigrants from South Eastern Asia are Immigrants from Eritrea ($47,657, a difference of 0.030%), Immigrants from Chile ($47,697, a difference of 0.060%), Luxembourger ($47,640, a difference of 0.060%), Immigrants from Saudi Arabia ($47,704, a difference of 0.070%), and Immigrants from Oceania ($47,617, a difference of 0.11%).
| Demographics | Rating | Rank | Median Earnings |
| Europeans | 88.9 /100 | #138 | Excellent $47,915 |
| Canadians | 88.8 /100 | #139 | Excellent $47,911 |
| Taiwanese | 88.7 /100 | #140 | Excellent $47,902 |
| Immigrants | Sierra Leone | 88.3 /100 | #141 | Excellent $47,875 |
| Ugandans | 88.0 /100 | #142 | Excellent $47,854 |
| Swedes | 88.0 /100 | #143 | Excellent $47,851 |
| Hungarians | 87.1 /100 | #144 | Excellent $47,795 |
| Immigrants | Saudi Arabia | 85.6 /100 | #145 | Excellent $47,704 |
| Immigrants | Chile | 85.5 /100 | #146 | Excellent $47,697 |
| Immigrants | South Eastern Asia | 85.0 /100 | #147 | Excellent $47,671 |
| Immigrants | Eritrea | 84.8 /100 | #148 | Excellent $47,657 |
| Luxembourgers | 84.5 /100 | #149 | Excellent $47,640 |
| Peruvians | 84.2 /100 | #150 | Excellent $47,628 |
| Immigrants | Oceania | 84.1 /100 | #151 | Excellent $47,617 |
| Immigrants | Germany | 83.1 /100 | #152 | Excellent $47,566 |
| Slavs | 81.1 /100 | #153 | Excellent $47,470 |
| Immigrants | Portugal | 77.3 /100 | #154 | Good $47,304 |
| Immigrants | Vietnam | 76.7 /100 | #155 | Good $47,282 |
| Irish | 76.6 /100 | #156 | Good $47,276 |
| Czechs | 75.1 /100 | #157 | Good $47,221 |
| Slovaks | 71.7 /100 | #158 | Good $47,095 |