Peruvian vs Houma Householder Income Under 25 years
COMPARE
Peruvian
Houma
Householder Income Under 25 years
Householder Income Under 25 years Comparison
Peruvians
Houma
$56,052
HOUSEHOLDER INCOME UNDER 25 YEARS
100.0/ 100
METRIC RATING
32nd/ 347
METRIC RANK
$44,356
HOUSEHOLDER INCOME UNDER 25 YEARS
0.0/ 100
METRIC RATING
341st/ 347
METRIC RANK
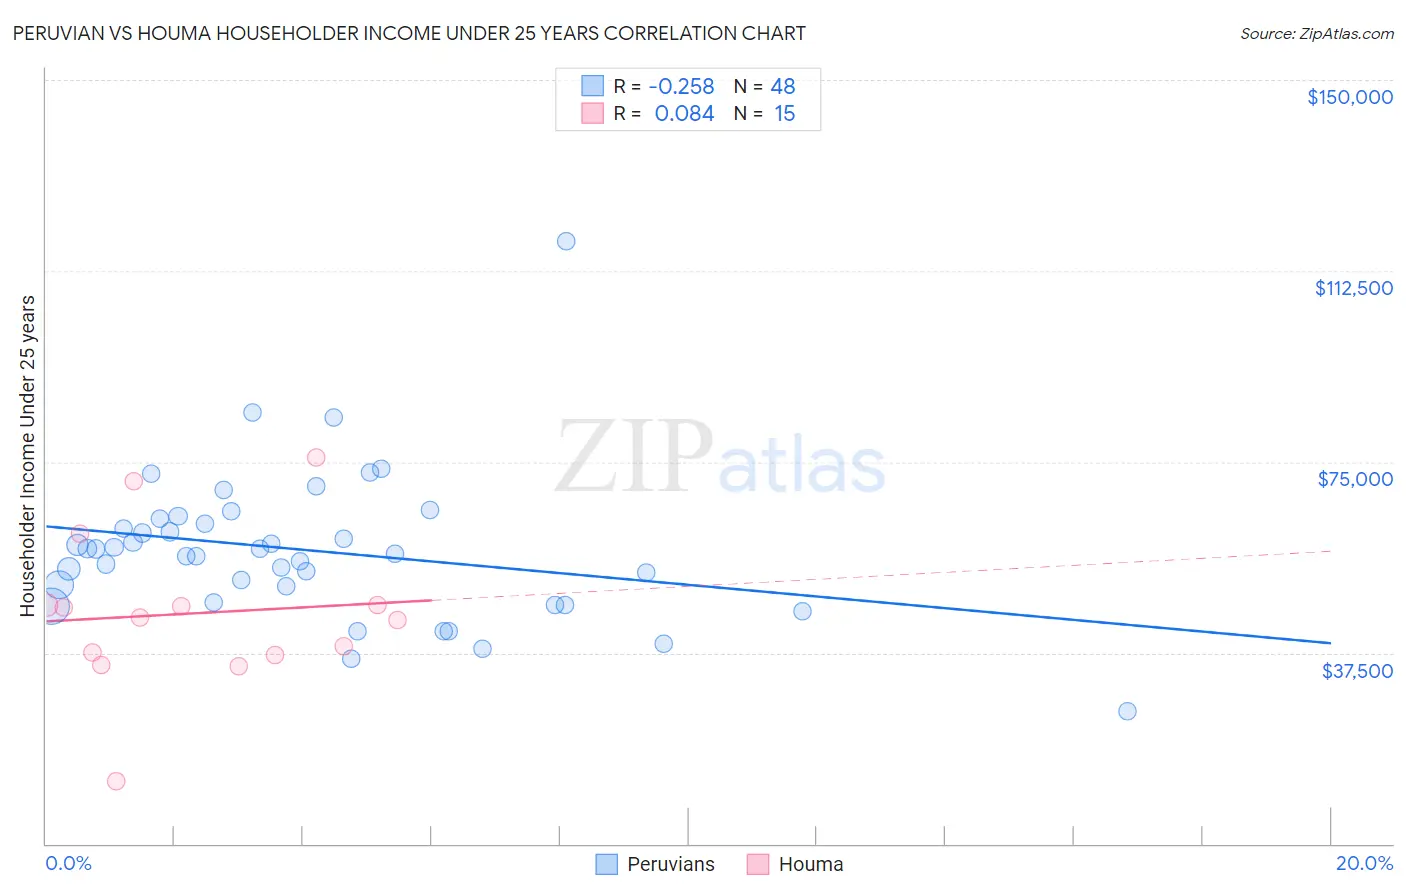
Peruvian vs Houma Householder Income Under 25 years Correlation Chart
The statistical analysis conducted on geographies consisting of 309,109,247 people shows a weak negative correlation between the proportion of Peruvians and household income with householder under the age of 25 in the United States with a correlation coefficient (R) of -0.258 and weighted average of $56,052. Similarly, the statistical analysis conducted on geographies consisting of 35,697,476 people shows a slight positive correlation between the proportion of Houma and household income with householder under the age of 25 in the United States with a correlation coefficient (R) of 0.084 and weighted average of $44,356, a difference of 26.4%.
Householder Income Under 25 years Correlation Summary
| Measurement | Peruvian | Houma |
| Minimum | $25,923 | $12,212 |
| Maximum | $118,438 | $75,747 |
| Range | $92,515 | $63,535 |
| Mean | $57,665 | $45,249 |
| Median | $57,415 | $44,434 |
| Interquartile 25% (IQ1) | $48,987 | $37,081 |
| Interquartile 75% (IQ3) | $63,410 | $46,891 |
| Interquartile Range (IQR) | $14,423 | $9,810 |
| Standard Deviation (Sample) | $14,693 | $15,434 |
| Standard Deviation (Population) | $14,539 | $14,910 |
Similar Demographics by Householder Income Under 25 years
Demographics Similar to Peruvians by Householder Income Under 25 years
In terms of householder income under 25 years, the demographic groups most similar to Peruvians are Vietnamese ($56,127, a difference of 0.13%), Immigrants from Moldova ($56,168, a difference of 0.21%), Inupiat ($55,935, a difference of 0.21%), Immigrants from Japan ($55,932, a difference of 0.21%), and Tlingit-Haida ($55,914, a difference of 0.25%).
| Demographics | Rating | Rank | Householder Income Under 25 years |
| Immigrants | Pakistan | 100.0 /100 | #25 | Exceptional $56,789 |
| Immigrants | Australia | 100.0 /100 | #26 | Exceptional $56,660 |
| Immigrants | North Macedonia | 100.0 /100 | #27 | Exceptional $56,503 |
| Immigrants | Peru | 100.0 /100 | #28 | Exceptional $56,384 |
| Immigrants | Asia | 100.0 /100 | #29 | Exceptional $56,379 |
| Immigrants | Moldova | 100.0 /100 | #30 | Exceptional $56,168 |
| Vietnamese | 100.0 /100 | #31 | Exceptional $56,127 |
| Peruvians | 100.0 /100 | #32 | Exceptional $56,052 |
| Inupiat | 100.0 /100 | #33 | Exceptional $55,935 |
| Immigrants | Japan | 100.0 /100 | #34 | Exceptional $55,932 |
| Tlingit-Haida | 100.0 /100 | #35 | Exceptional $55,914 |
| Immigrants | Israel | 100.0 /100 | #36 | Exceptional $55,913 |
| Immigrants | Russia | 100.0 /100 | #37 | Exceptional $55,891 |
| Immigrants | Iran | 100.0 /100 | #38 | Exceptional $55,880 |
| Immigrants | Belarus | 100.0 /100 | #39 | Exceptional $55,743 |
Demographics Similar to Houma by Householder Income Under 25 years
In terms of householder income under 25 years, the demographic groups most similar to Houma are Black/African American ($44,381, a difference of 0.060%), Arapaho ($44,003, a difference of 0.80%), Kiowa ($44,733, a difference of 0.85%), Chickasaw ($44,763, a difference of 0.92%), and Pueblo ($45,018, a difference of 1.5%).
| Demographics | Rating | Rank | Householder Income Under 25 years |
| Creek | 0.0 /100 | #333 | Tragic $45,371 |
| Cajuns | 0.0 /100 | #334 | Tragic $45,338 |
| Cheyenne | 0.0 /100 | #335 | Tragic $45,275 |
| Tohono O'odham | 0.0 /100 | #336 | Tragic $45,248 |
| Pueblo | 0.0 /100 | #337 | Tragic $45,018 |
| Chickasaw | 0.0 /100 | #338 | Tragic $44,763 |
| Kiowa | 0.0 /100 | #339 | Tragic $44,733 |
| Blacks/African Americans | 0.0 /100 | #340 | Tragic $44,381 |
| Houma | 0.0 /100 | #341 | Tragic $44,356 |
| Arapaho | 0.0 /100 | #342 | Tragic $44,003 |
| Immigrants | Yemen | 0.0 /100 | #343 | Tragic $43,591 |
| Immigrants | Congo | 0.0 /100 | #344 | Tragic $43,266 |
| Navajo | 0.0 /100 | #345 | Tragic $42,380 |
| Puerto Ricans | 0.0 /100 | #346 | Tragic $39,726 |
| Lumbee | 0.0 /100 | #347 | Tragic $34,584 |