Paraguayan vs Pennsylvania German Median Male Earnings
COMPARE
Paraguayan
Pennsylvania German
Median Male Earnings
Median Male Earnings Comparison
Paraguayans
Pennsylvania Germans
$59,975
MEDIAN MALE EARNINGS
99.5/ 100
METRIC RATING
77th/ 347
METRIC RANK
$50,878
MEDIAN MALE EARNINGS
2.8/ 100
METRIC RATING
236th/ 347
METRIC RANK
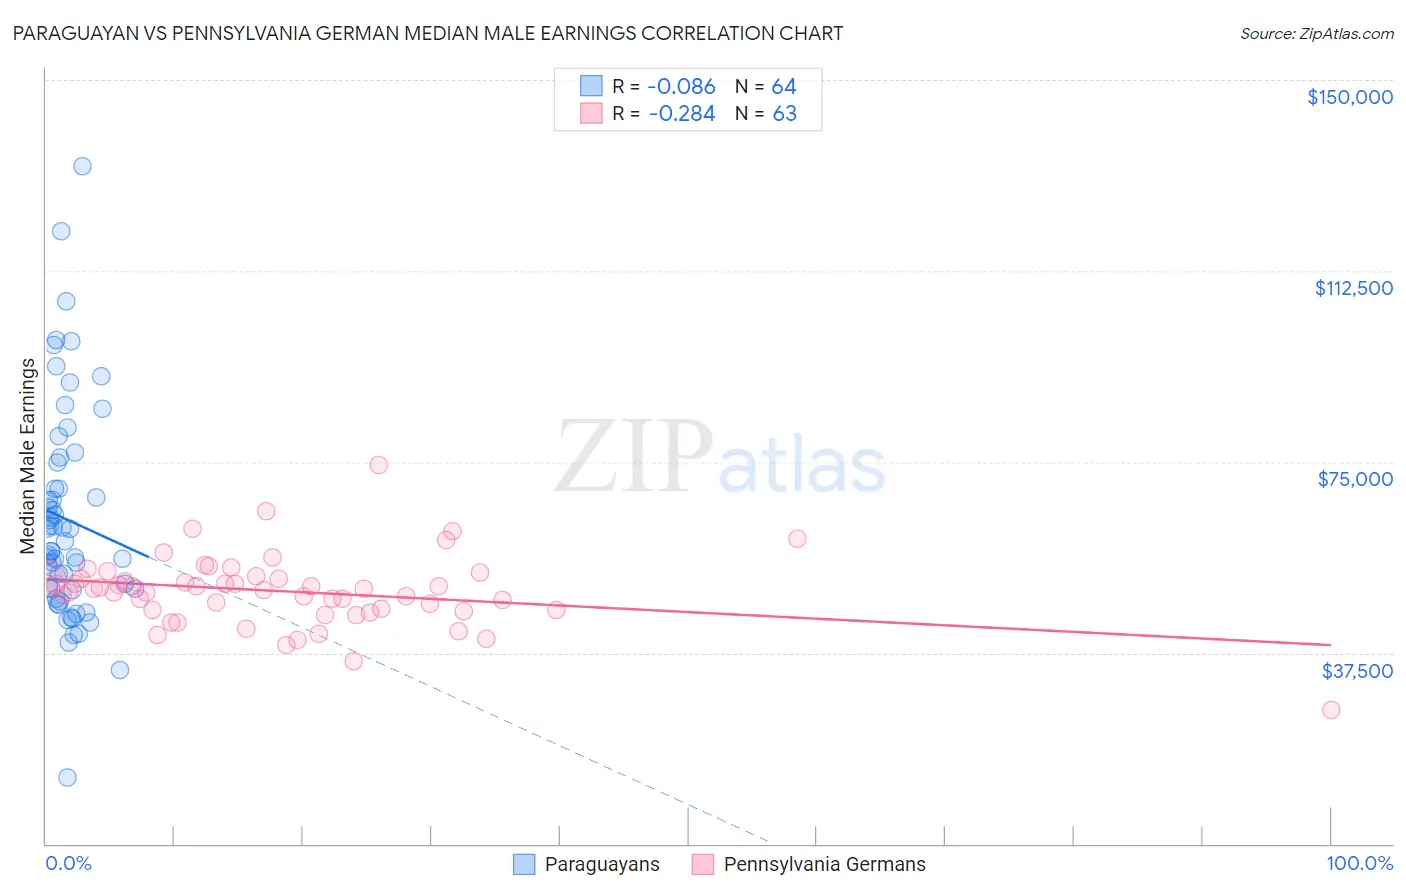
Paraguayan vs Pennsylvania German Median Male Earnings Correlation Chart
The statistical analysis conducted on geographies consisting of 95,078,142 people shows a slight negative correlation between the proportion of Paraguayans and median male earnings in the United States with a correlation coefficient (R) of -0.086 and weighted average of $59,975. Similarly, the statistical analysis conducted on geographies consisting of 233,999,386 people shows a weak negative correlation between the proportion of Pennsylvania Germans and median male earnings in the United States with a correlation coefficient (R) of -0.284 and weighted average of $50,878, a difference of 17.9%.
Median Male Earnings Correlation Summary
| Measurement | Paraguayan | Pennsylvania German |
| Minimum | $13,000 | $26,250 |
| Maximum | $133,125 | $74,375 |
| Range | $120,125 | $48,125 |
| Mean | $63,648 | $49,588 |
| Median | $58,508 | $50,000 |
| Interquartile 25% (IQ1) | $49,873 | $45,795 |
| Interquartile 75% (IQ3) | $72,390 | $52,150 |
| Interquartile Range (IQR) | $22,517 | $6,355 |
| Standard Deviation (Sample) | $21,137 | $7,111 |
| Standard Deviation (Population) | $20,971 | $7,054 |
Similar Demographics by Median Male Earnings
Demographics Similar to Paraguayans by Median Male Earnings
In terms of median male earnings, the demographic groups most similar to Paraguayans are Immigrants from Egypt ($59,925, a difference of 0.080%), Romanian ($60,063, a difference of 0.15%), Immigrants from Bolivia ($60,088, a difference of 0.19%), Argentinean ($60,117, a difference of 0.24%), and Immigrants from Ukraine ($59,820, a difference of 0.26%).
| Demographics | Rating | Rank | Median Male Earnings |
| Immigrants | Bulgaria | 99.7 /100 | #70 | Exceptional $60,358 |
| Mongolians | 99.7 /100 | #71 | Exceptional $60,350 |
| Immigrants | Western Europe | 99.7 /100 | #72 | Exceptional $60,334 |
| Immigrants | North America | 99.7 /100 | #73 | Exceptional $60,265 |
| Argentineans | 99.6 /100 | #74 | Exceptional $60,117 |
| Immigrants | Bolivia | 99.6 /100 | #75 | Exceptional $60,088 |
| Romanians | 99.6 /100 | #76 | Exceptional $60,063 |
| Paraguayans | 99.5 /100 | #77 | Exceptional $59,975 |
| Immigrants | Egypt | 99.5 /100 | #78 | Exceptional $59,925 |
| Immigrants | Ukraine | 99.5 /100 | #79 | Exceptional $59,820 |
| Immigrants | Hungary | 99.5 /100 | #80 | Exceptional $59,806 |
| Ukrainians | 99.4 /100 | #81 | Exceptional $59,728 |
| Croatians | 99.4 /100 | #82 | Exceptional $59,715 |
| Immigrants | Italy | 99.4 /100 | #83 | Exceptional $59,691 |
| Afghans | 99.3 /100 | #84 | Exceptional $59,554 |
Demographics Similar to Pennsylvania Germans by Median Male Earnings
In terms of median male earnings, the demographic groups most similar to Pennsylvania Germans are Immigrants from Western Africa ($50,940, a difference of 0.12%), Immigrants from Barbados ($50,795, a difference of 0.16%), Malaysian ($50,772, a difference of 0.21%), American ($50,761, a difference of 0.23%), and West Indian ($50,682, a difference of 0.39%).
| Demographics | Rating | Rank | Median Male Earnings |
| Immigrants | Trinidad and Tobago | 4.5 /100 | #229 | Tragic $51,376 |
| Immigrants | Nigeria | 4.2 /100 | #230 | Tragic $51,310 |
| Barbadians | 3.9 /100 | #231 | Tragic $51,236 |
| Sudanese | 3.9 /100 | #232 | Tragic $51,216 |
| Aleuts | 3.7 /100 | #233 | Tragic $51,168 |
| Cape Verdeans | 3.5 /100 | #234 | Tragic $51,103 |
| Immigrants | Western Africa | 3.0 /100 | #235 | Tragic $50,940 |
| Pennsylvania Germans | 2.8 /100 | #236 | Tragic $50,878 |
| Immigrants | Barbados | 2.6 /100 | #237 | Tragic $50,795 |
| Malaysians | 2.5 /100 | #238 | Tragic $50,772 |
| Americans | 2.5 /100 | #239 | Tragic $50,761 |
| West Indians | 2.3 /100 | #240 | Tragic $50,682 |
| Immigrants | St. Vincent and the Grenadines | 2.3 /100 | #241 | Tragic $50,665 |
| Guyanese | 2.2 /100 | #242 | Tragic $50,613 |
| French American Indians | 2.2 /100 | #243 | Tragic $50,611 |