Panamanian vs Polish Per Capita Income

COMPARE

Panamanian
Race
Ancestry
AfghanAfricanAlaska NativeAlaskan AthabascanAlbanianAleutAlsatianAmericanApacheArabArapahoArgentineanArmenianAssyrian/Chaldean/SyriacAustralianAustrianBahamianBangladeshiBarbadianBasqueBelgianBelizeanBermudanBhutaneseBlackfeetBolivianBrazilianBritishBritish West IndianBulgarianBurmeseCajunCambodianCanadianCape VerdeanCarpatho RusynCelticCentral AmericanCentral American IndianCherokeeCheyenneChickasawChileanChineseChippewaChoctawColombianColvilleComancheCosta RicanCreeCreekCroatianCrowCubanCypriotCzechCzechoslovakianDanishDelawareDominicanDutchDutch West IndianEastern EuropeanEcuadorianEgyptianEnglishEstonianEthiopianEuropeanFijianFilipinoFinnishFrenchFrench American IndianFrench CanadianGermanGerman RussianGhanaianGreekGuamanian/ChamorroGuatemalanGuyaneseHaitianHmongHonduranHopiHoumaHungarianIcelanderIndian (Asian)IndonesianInupiatIranianIraqiIrishIroquoisIsraeliItalianJamaicanJapaneseJordanianKenyanKiowaKoreanLaotianLatvianLebaneseLiberianLithuanianLumbeeLuxembourgerMacedonianMalaysianMalteseMarshalleseMenomineeMexicanMexican American IndianMongolianMoroccanNative HawaiianNavajoNepaleseNew ZealanderNicaraguanNigerianNorthern EuropeanNorwegianOkinawanOsageOttawaPaiutePakistaniPalestinianPanamanianParaguayanPennsylvania GermanPeruvianPimaPortuguesePotawatomiPuebloPuerto RicanPuget Sound SalishRomanianRussianSalvadoranSamoanScandinavianScotch-IrishScottishSeminoleSenegaleseSerbianShoshoneSierra LeoneanSiouxSlavicSlovakSloveneSomaliSouth AfricanSouth AmericanSouth American IndianSoviet UnionSpaniardSpanishSpanish AmericanSpanish American IndianSri LankanSubsaharan AfricanSudaneseSwedishSwissSyrianTaiwaneseThaiTlingit-HaidaTohono O'OdhamTonganTrinidadian and TobagonianTsimshianTurkishU.S. Virgin IslanderUgandanUkrainianUruguayanUteVenezuelanVietnameseWelshWest IndianYakamaYaquiYugoslavianYumanYup'ikZimbabwean
Immigration
NonimmigrantsImmigrantsAfghanistanAfricaAlbaniaArgentinaArmeniaAsiaAustraliaAustriaBahamasBangladeshBarbadosBelarusBelgiumBelizeBoliviaBosnia and HerzegovinaBrazilBulgariaBurma/MyanmarCabo VerdeCambodiaCameroonCanadaCaribbeanCentral AmericaChileChinaColombiaCongoCosta RicaCroatiaCubaCzechoslovakiaDenmarkDominicaDominican RepublicEastern AfricaEastern AsiaEastern EuropeEcuadorEgyptEl SalvadorEnglandEritreaEthiopiaEuropeFijiFranceGermanyGhanaGreeceGrenadaGuatemalaGuyanaHaitiHondurasHong KongHungaryIndiaIndonesiaIranIraqIrelandIsraelItalyJamaicaJapanJordanKazakhstanKenyaKoreaKuwaitLaosLatin AmericaLatviaLebanonLiberiaLithuaniaMalaysiaMexicoMicronesiaMiddle AfricaMoldovaMoroccoNepalNetherlandsNicaraguaNigeriaNorth AmericaNorth MacedoniaNorthern AfricaNorthern EuropeNorwayOceaniaPakistanPanamaPeruPhilippinesPolandPortugalRomaniaRussiaSaudi ArabiaScotlandSenegalSerbiaSierra LeoneSingaporeSomaliaSouth AfricaSouth AmericaSouth Central AsiaSouth Eastern AsiaSouthern EuropeSpainSri LankaSt. Vincent and the GrenadinesSudanSwedenSwitzerlandSyriaTaiwanThailandTrinidad and TobagoTurkeyUgandaUkraineUruguayUzbekistanVenezuelaVietnamWest IndiesWestern AfricaWestern AsiaWestern EuropeYemenZaireZimbabweAzores
Polish
Race
Ancestry
AfghanAfricanAlaska NativeAlaskan AthabascanAlbanianAleutAlsatianAmericanApacheArabArapahoArgentineanArmenianAssyrian/Chaldean/SyriacAustralianAustrianBahamianBangladeshiBarbadianBasqueBelgianBelizeanBermudanBhutaneseBlackfeetBolivianBrazilianBritishBritish West IndianBulgarianBurmeseCajunCambodianCanadianCape VerdeanCarpatho RusynCelticCentral AmericanCentral American IndianCherokeeCheyenneChickasawChileanChineseChippewaChoctawColombianColvilleComancheCosta RicanCreeCreekCroatianCrowCubanCypriotCzechCzechoslovakianDanishDelawareDominicanDutchDutch West IndianEastern EuropeanEcuadorianEgyptianEnglishEstonianEthiopianEuropeanFijianFilipinoFinnishFrenchFrench American IndianFrench CanadianGermanGerman RussianGhanaianGreekGuamanian/ChamorroGuatemalanGuyaneseHaitianHmongHonduranHopiHoumaHungarianIcelanderIndian (Asian)IndonesianInupiatIranianIraqiIrishIroquoisIsraeliItalianJamaicanJapaneseJordanianKenyanKiowaKoreanLaotianLatvianLebaneseLiberianLithuanianLumbeeLuxembourgerMacedonianMalaysianMalteseMarshalleseMenomineeMexicanMexican American IndianMongolianMoroccanNative HawaiianNavajoNepaleseNew ZealanderNicaraguanNigerianNorthern EuropeanNorwegianOkinawanOsageOttawaPaiutePakistaniPalestinianParaguayanPennsylvania GermanPeruvianPimaPolishPortuguesePotawatomiPuebloPuerto RicanPuget Sound SalishRomanianRussianSalvadoranSamoanScandinavianScotch-IrishScottishSeminoleSenegaleseSerbianShoshoneSierra LeoneanSiouxSlavicSlovakSloveneSomaliSouth AfricanSouth AmericanSouth American IndianSoviet UnionSpaniardSpanishSpanish AmericanSpanish American IndianSri LankanSubsaharan AfricanSudaneseSwedishSwissSyrianTaiwaneseThaiTlingit-HaidaTohono O'OdhamTonganTrinidadian and TobagonianTsimshianTurkishU.S. Virgin IslanderUgandanUkrainianUruguayanUteVenezuelanVietnameseWelshWest IndianYakamaYaquiYugoslavianYumanYup'ikZimbabwean
Immigration
NonimmigrantsImmigrantsAfghanistanAfricaAlbaniaArgentinaArmeniaAsiaAustraliaAustriaBahamasBangladeshBarbadosBelarusBelgiumBelizeBoliviaBosnia and HerzegovinaBrazilBulgariaBurma/MyanmarCabo VerdeCambodiaCameroonCanadaCaribbeanCentral AmericaChileChinaColombiaCongoCosta RicaCroatiaCubaCzechoslovakiaDenmarkDominicaDominican RepublicEastern AfricaEastern AsiaEastern EuropeEcuadorEgyptEl SalvadorEnglandEritreaEthiopiaEuropeFijiFranceGermanyGhanaGreeceGrenadaGuatemalaGuyanaHaitiHondurasHong KongHungaryIndiaIndonesiaIranIraqIrelandIsraelItalyJamaicaJapanJordanKazakhstanKenyaKoreaKuwaitLaosLatin AmericaLatviaLebanonLiberiaLithuaniaMalaysiaMexicoMicronesiaMiddle AfricaMoldovaMoroccoNepalNetherlandsNicaraguaNigeriaNorth AmericaNorth MacedoniaNorthern AfricaNorthern EuropeNorwayOceaniaPakistanPanamaPeruPhilippinesPolandPortugalRomaniaRussiaSaudi ArabiaScotlandSenegalSerbiaSierra LeoneSingaporeSomaliaSouth AfricaSouth AmericaSouth Central AsiaSouth Eastern AsiaSouthern EuropeSpainSri LankaSt. Vincent and the GrenadinesSudanSwedenSwitzerlandSyriaTaiwanThailandTrinidad and TobagoTurkeyUgandaUkraineUruguayUzbekistanVenezuelaVietnamWest IndiesWestern AfricaWestern AsiaWestern EuropeYemenZaireZimbabweAzores
Per Capita Income
Income
Poverty
Unemployment
Labor Participation
Family Structure
Vehicle Availability
Education Level
Disability

Per Capita Income Comparison

Panamanians

Poles

Poor
Exceptional
$42,035
PER CAPITA INCOME
13.9/ 100
METRIC RATING
208th/ 347
METRIC RANK
$46,123
PER CAPITA INCOME
94.1/ 100
METRIC RATING
116th/ 347
METRIC RANK

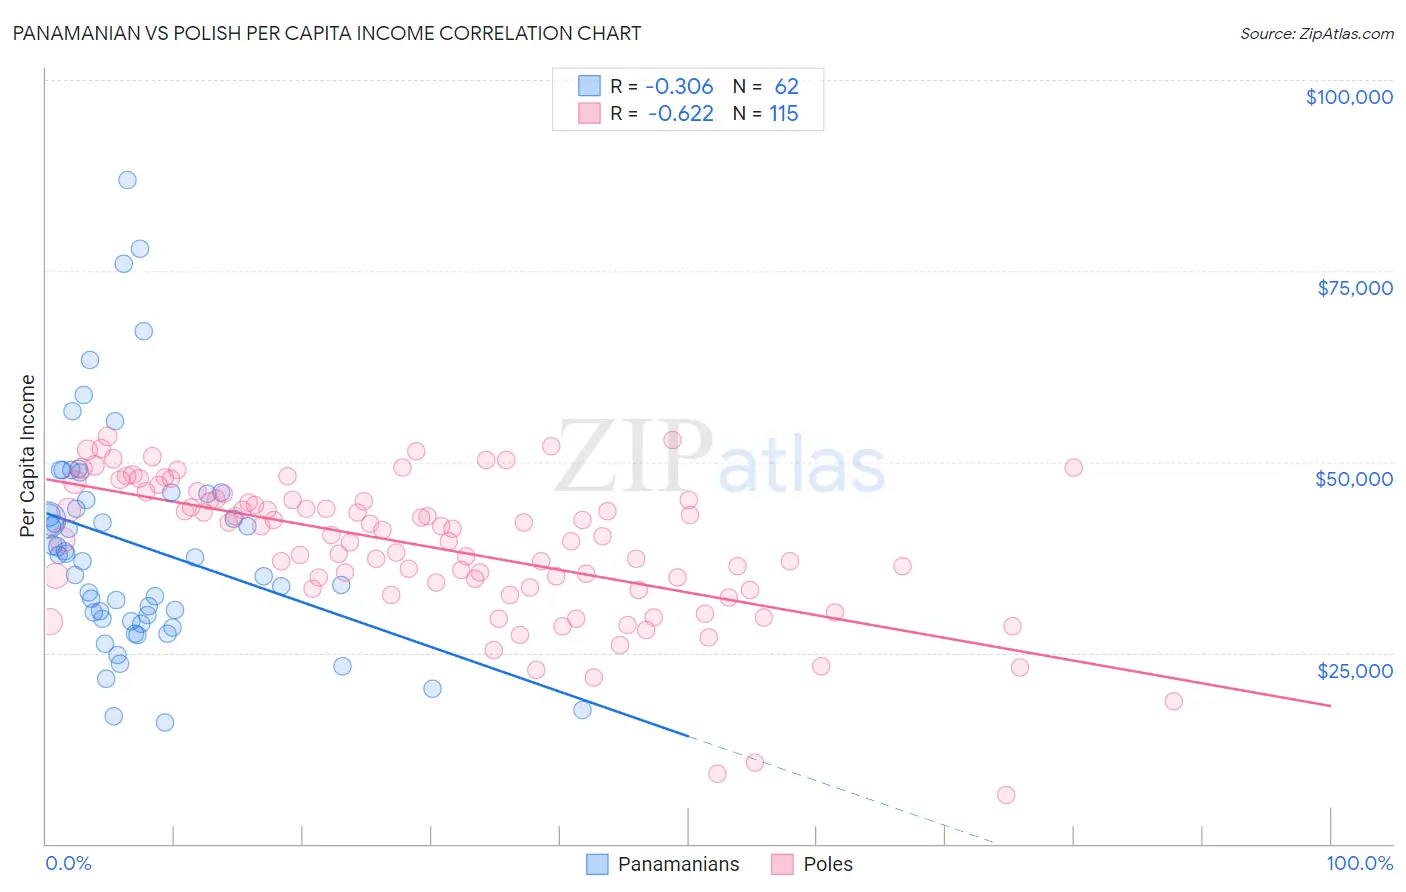
Panamanian vs Polish Per Capita Income Correlation Chart

The statistical analysis conducted on geographies consisting of 281,258,630 people shows a mild negative correlation between the proportion of Panamanians and per capita income in the United States with a correlation coefficient (R) of -0.306 and weighted average of $42,035. Similarly, the statistical analysis conducted on geographies consisting of 560,657,396 people shows a significant negative correlation between the proportion of Poles and per capita income in the United States with a correlation coefficient (R) of -0.622 and weighted average of $46,123, a difference of 9.7%.
Panamanian vs Polish Per Capita Income

Per Capita Income Correlation Summary

MeasurementPanamanianPolish
Minimum$15,844$6,461
Maximum$86,907$53,317
Range$71,063$46,856
Mean$39,085$38,750
Median$37,643$40,450
Interquartile 25% (IQ1)$29,415$33,437
Interquartile 75% (IQ3)$45,746$44,990
Interquartile Range (IQR)$16,331$11,553
Standard Deviation (Sample)$14,450$9,315
Standard Deviation (Population)$14,333$9,274

Similar Demographics by Per Capita Income

Demographics Similar to Panamanians by Per Capita Income

In terms of per capita income, the demographic groups most similar to Panamanians are Venezuelan ($42,074, a difference of 0.090%), Immigrants from Sudan ($41,986, a difference of 0.12%), Ecuadorian ($41,958, a difference of 0.18%), Ghanaian ($42,164, a difference of 0.31%), and White/Caucasian ($42,180, a difference of 0.35%).
DemographicsRating | RankPer Capita Income
Immigrants | Thailand
17.6
/100
|
#201
Poor
$42,289
Immigrants | Bosnia and Herzegovina
17.5
/100
|
#202
Poor
$42,278
Spanish
17.0
/100
|
#203
Poor
$42,249
Aleuts
16.4
/100
|
#204
Poor
$42,210
Whites/Caucasians
15.9
/100
|
#205
Poor
$42,180
Ghanaians
15.7
/100
|
#206
Poor
$42,164
Venezuelans
14.4
/100
|
#207
Poor
$42,074
Panamanians
13.9
/100
|
#208
Poor
$42,035
Immigrants | Sudan
13.2
/100
|
#209
Poor
$41,986
Ecuadorians
12.9
/100
|
#210
Poor
$41,958
Immigrants | Panama
11.6
/100
|
#211
Poor
$41,853
Immigrants | Senegal
11.3
/100
|
#212
Poor
$41,830
Immigrants | Venezuela
10.2
/100
|
#213
Poor
$41,727
Immigrants | Bangladesh
10.1
/100
|
#214
Poor
$41,709
Sudanese
9.9
/100
|
#215
Tragic
$41,695

Demographics Similar to Poles by Per Capita Income

In terms of per capita income, the demographic groups most similar to Poles are Chinese ($46,098, a difference of 0.050%), Immigrants from Chile ($46,213, a difference of 0.20%), Immigrants from Saudi Arabia ($46,008, a difference of 0.25%), Immigrants from Poland ($45,979, a difference of 0.31%), and Afghan ($46,268, a difference of 0.32%).
DemographicsRating | RankPer Capita Income
Immigrants | Northern Africa
96.2
/100
|
#109
Exceptional
$46,531
Chileans
95.9
/100
|
#110
Exceptional
$46,459
Taiwanese
95.8
/100
|
#111
Exceptional
$46,455
Immigrants | Morocco
95.7
/100
|
#112
Exceptional
$46,430
Immigrants | Albania
95.5
/100
|
#113
Exceptional
$46,387
Afghans
94.9
/100
|
#114
Exceptional
$46,268
Immigrants | Chile
94.6
/100
|
#115
Exceptional
$46,213
Poles
94.1
/100
|
#116
Exceptional
$46,123
Chinese
93.9
/100
|
#117
Exceptional
$46,098
Immigrants | Saudi Arabia
93.3
/100
|
#118
Exceptional
$46,008
Immigrants | Poland
93.1
/100
|
#119
Exceptional
$45,979
Immigrants | Ethiopia
92.7
/100
|
#120
Exceptional
$45,923
Canadians
92.2
/100
|
#121
Exceptional
$45,858
Moroccans
92.1
/100
|
#122
Exceptional
$45,854
Lebanese
92.0
/100
|
#123
Exceptional
$45,840