Palestinian vs Immigrants from Jordan Median Male Earnings
COMPARE
Palestinian
Immigrants from Jordan
Median Male Earnings
Median Male Earnings Comparison
Palestinians
Immigrants from Jordan
$57,778
MEDIAN MALE EARNINGS
96.2/ 100
METRIC RATING
110th/ 347
METRIC RANK
$57,145
MEDIAN MALE EARNINGS
93.1/ 100
METRIC RATING
122nd/ 347
METRIC RANK
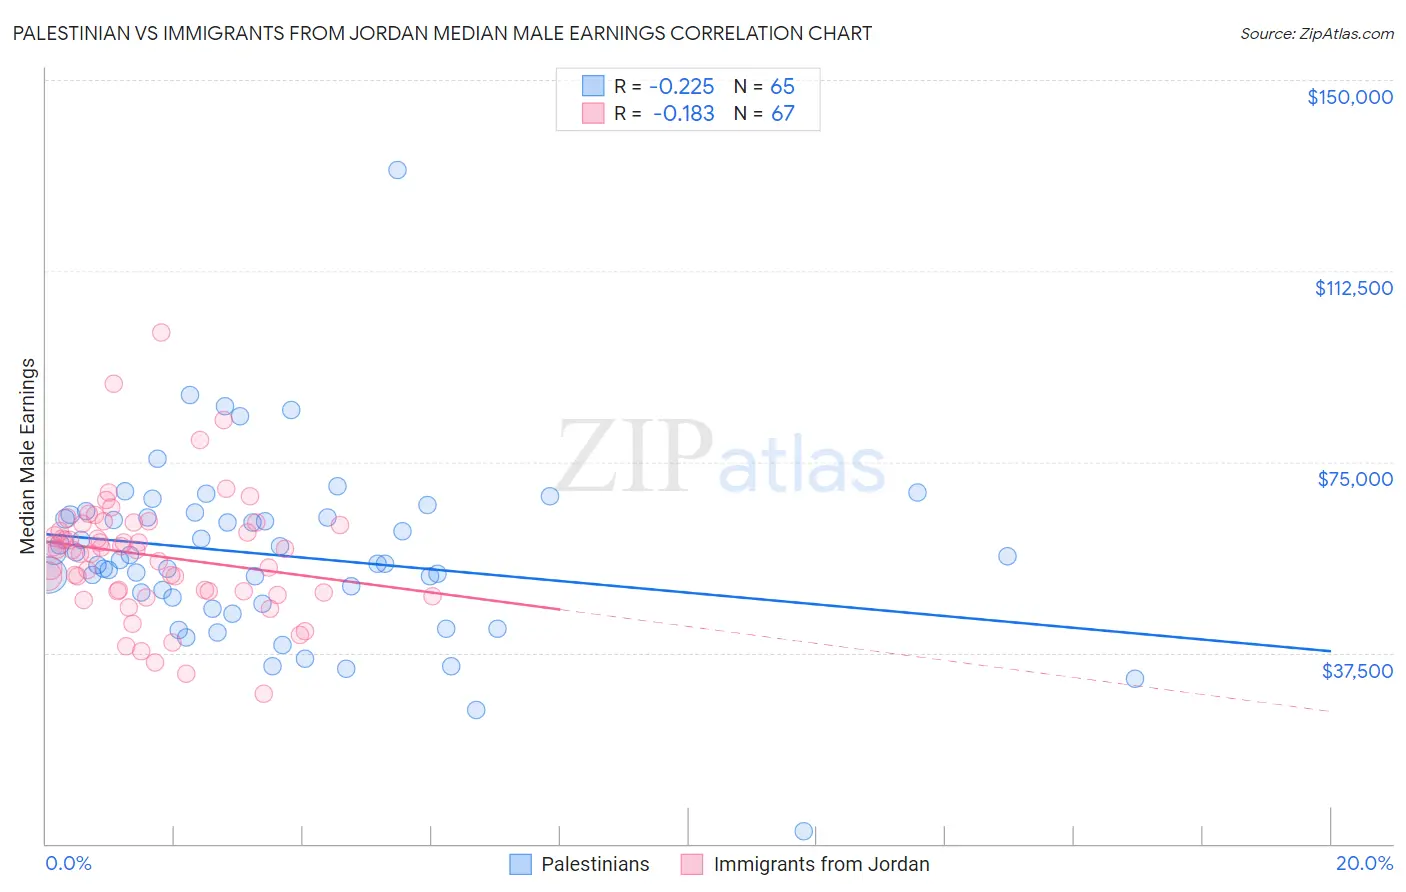
Palestinian vs Immigrants from Jordan Median Male Earnings Correlation Chart
The statistical analysis conducted on geographies consisting of 216,446,429 people shows a weak negative correlation between the proportion of Palestinians and median male earnings in the United States with a correlation coefficient (R) of -0.225 and weighted average of $57,778. Similarly, the statistical analysis conducted on geographies consisting of 181,244,251 people shows a poor negative correlation between the proportion of Immigrants from Jordan and median male earnings in the United States with a correlation coefficient (R) of -0.183 and weighted average of $57,145, a difference of 1.1%.
Median Male Earnings Correlation Summary
| Measurement | Palestinian | Immigrants from Jordan |
| Minimum | $2,499 | $29,414 |
| Maximum | $132,344 | $100,501 |
| Range | $129,845 | $71,087 |
| Mean | $56,632 | $56,566 |
| Median | $55,657 | $57,678 |
| Interquartile 25% (IQ1) | $47,716 | $49,640 |
| Interquartile 75% (IQ3) | $64,385 | $62,778 |
| Interquartile Range (IQR) | $16,670 | $13,138 |
| Standard Deviation (Sample) | $17,442 | $12,126 |
| Standard Deviation (Population) | $17,308 | $12,035 |
Demographics Similar to Palestinians and Immigrants from Jordan by Median Male Earnings
In terms of median male earnings, the demographic groups most similar to Palestinians are British ($57,890, a difference of 0.19%), European ($57,637, a difference of 0.25%), Immigrants from Uzbekistan ($57,941, a difference of 0.28%), Serbian ($57,975, a difference of 0.34%), and Immigrants from Afghanistan ($57,582, a difference of 0.34%). Similarly, the demographic groups most similar to Immigrants from Jordan are Slovene ($57,145, a difference of 0.0%), Immigrants from Albania ($57,179, a difference of 0.060%), Canadian ($57,286, a difference of 0.25%), Arab ($57,298, a difference of 0.27%), and Hungarian ($57,309, a difference of 0.29%).
| Demographics | Rating | Rank | Median Male Earnings |
| Immigrants | Northern Africa | 96.9 /100 | #106 | Exceptional $58,008 |
| Serbians | 96.8 /100 | #107 | Exceptional $57,975 |
| Immigrants | Uzbekistan | 96.7 /100 | #108 | Exceptional $57,941 |
| British | 96.5 /100 | #109 | Exceptional $57,890 |
| Palestinians | 96.2 /100 | #110 | Exceptional $57,778 |
| Europeans | 95.6 /100 | #111 | Exceptional $57,637 |
| Immigrants | Afghanistan | 95.4 /100 | #112 | Exceptional $57,582 |
| Carpatho Rusyns | 95.3 /100 | #113 | Exceptional $57,572 |
| Immigrants | Kuwait | 95.3 /100 | #114 | Exceptional $57,562 |
| Swedes | 94.8 /100 | #115 | Exceptional $57,445 |
| Lebanese | 94.6 /100 | #116 | Exceptional $57,409 |
| Immigrants | Zimbabwe | 94.3 /100 | #117 | Exceptional $57,352 |
| Hungarians | 94.0 /100 | #118 | Exceptional $57,309 |
| Arabs | 94.0 /100 | #119 | Exceptional $57,298 |
| Canadians | 93.9 /100 | #120 | Exceptional $57,286 |
| Immigrants | Albania | 93.3 /100 | #121 | Exceptional $57,179 |
| Immigrants | Jordan | 93.1 /100 | #122 | Exceptional $57,145 |
| Slovenes | 93.1 /100 | #123 | Exceptional $57,145 |
| Chileans | 91.9 /100 | #124 | Exceptional $56,973 |
| Immigrants | Morocco | 91.8 /100 | #125 | Exceptional $56,958 |
| Chinese | 91.1 /100 | #126 | Exceptional $56,872 |