Pakistani vs Swiss Median Male Earnings
COMPARE
Pakistani
Swiss
Median Male Earnings
Median Male Earnings Comparison
Pakistanis
Swiss
$56,719
MEDIAN MALE EARNINGS
89.9/ 100
METRIC RATING
129th/ 347
METRIC RANK
$55,731
MEDIAN MALE EARNINGS
77.1/ 100
METRIC RATING
150th/ 347
METRIC RANK
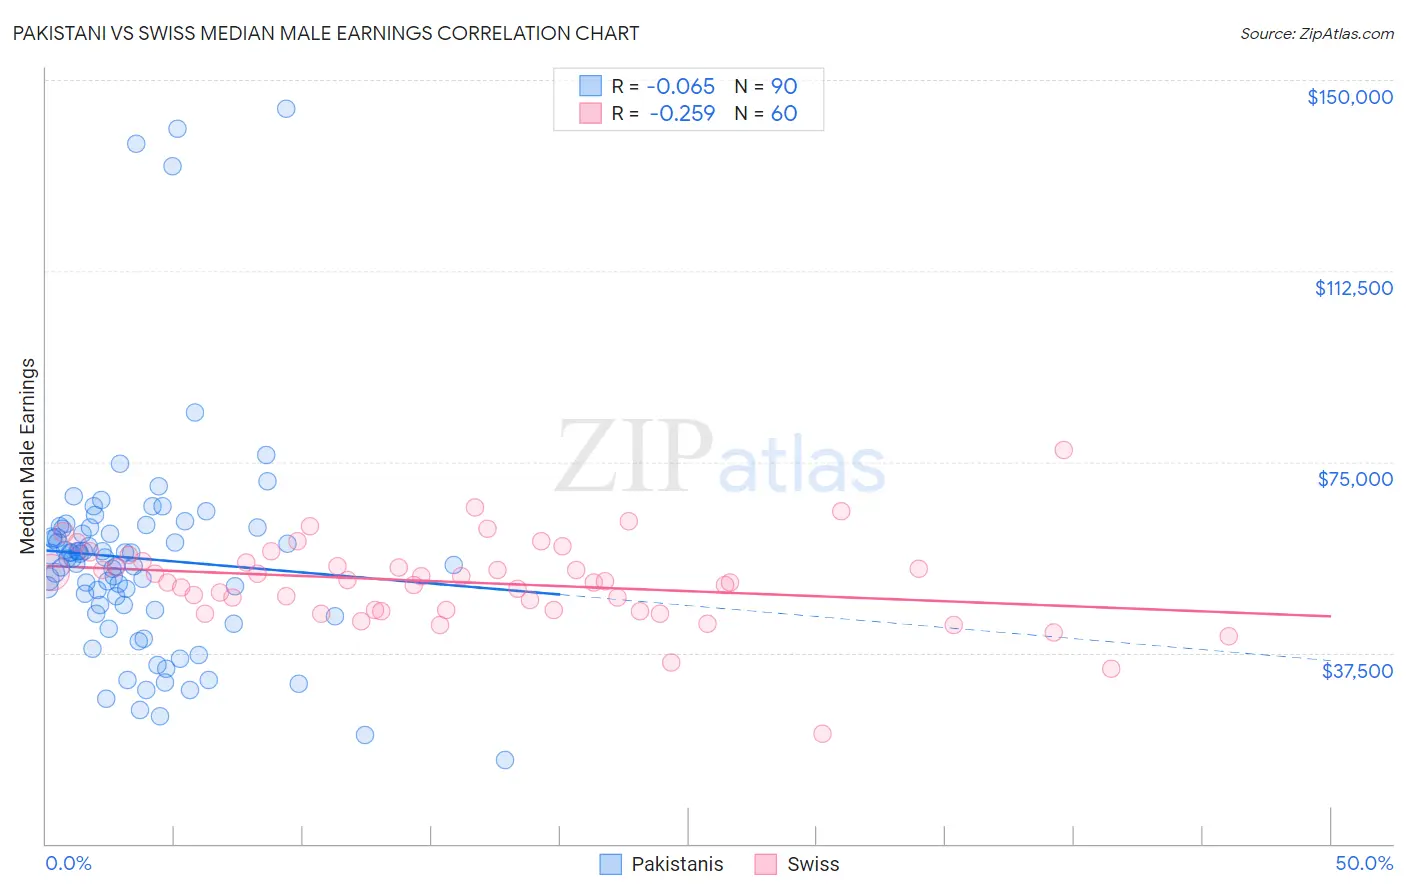
Pakistani vs Swiss Median Male Earnings Correlation Chart
The statistical analysis conducted on geographies consisting of 335,324,155 people shows a slight negative correlation between the proportion of Pakistanis and median male earnings in the United States with a correlation coefficient (R) of -0.065 and weighted average of $56,719. Similarly, the statistical analysis conducted on geographies consisting of 464,659,146 people shows a weak negative correlation between the proportion of Swiss and median male earnings in the United States with a correlation coefficient (R) of -0.259 and weighted average of $55,731, a difference of 1.8%.
Median Male Earnings Correlation Summary
| Measurement | Pakistani | Swiss |
| Minimum | $16,406 | $21,563 |
| Maximum | $144,236 | $77,386 |
| Range | $127,830 | $55,823 |
| Mean | $56,003 | $51,336 |
| Median | $55,878 | $51,444 |
| Interquartile 25% (IQ1) | $45,960 | $45,855 |
| Interquartile 75% (IQ3) | $61,933 | $55,388 |
| Interquartile Range (IQR) | $15,973 | $9,533 |
| Standard Deviation (Sample) | $22,100 | $8,461 |
| Standard Deviation (Population) | $21,977 | $8,390 |
Similar Demographics by Median Male Earnings
Demographics Similar to Pakistanis by Median Male Earnings
In terms of median male earnings, the demographic groups most similar to Pakistanis are Korean ($56,672, a difference of 0.080%), Portuguese ($56,663, a difference of 0.10%), Immigrants from Syria ($56,830, a difference of 0.20%), Brazilian ($56,837, a difference of 0.21%), and Chinese ($56,872, a difference of 0.27%).
| Demographics | Rating | Rank | Median Male Earnings |
| Immigrants | Jordan | 93.1 /100 | #122 | Exceptional $57,145 |
| Slovenes | 93.1 /100 | #123 | Exceptional $57,145 |
| Chileans | 91.9 /100 | #124 | Exceptional $56,973 |
| Immigrants | Morocco | 91.8 /100 | #125 | Exceptional $56,958 |
| Chinese | 91.1 /100 | #126 | Exceptional $56,872 |
| Brazilians | 90.9 /100 | #127 | Exceptional $56,837 |
| Immigrants | Syria | 90.8 /100 | #128 | Exceptional $56,830 |
| Pakistanis | 89.9 /100 | #129 | Excellent $56,719 |
| Koreans | 89.4 /100 | #130 | Excellent $56,672 |
| Portuguese | 89.4 /100 | #131 | Excellent $56,663 |
| Czechs | 88.2 /100 | #132 | Excellent $56,546 |
| Immigrants | Germany | 88.2 /100 | #133 | Excellent $56,542 |
| Moroccans | 87.7 /100 | #134 | Excellent $56,499 |
| Irish | 87.4 /100 | #135 | Excellent $56,464 |
| Immigrants | Saudi Arabia | 87.2 /100 | #136 | Excellent $56,452 |
Demographics Similar to Swiss by Median Male Earnings
In terms of median male earnings, the demographic groups most similar to Swiss are English ($55,747, a difference of 0.030%), Immigrants from Oceania ($55,712, a difference of 0.030%), Scottish ($55,793, a difference of 0.11%), Peruvian ($55,659, a difference of 0.13%), and Immigrants from Philippines ($55,809, a difference of 0.14%).
| Demographics | Rating | Rank | Median Male Earnings |
| Sri Lankans | 83.4 /100 | #143 | Excellent $56,136 |
| Immigrants | Uganda | 82.4 /100 | #144 | Excellent $56,064 |
| Norwegians | 80.9 /100 | #145 | Excellent $55,965 |
| Immigrants | Chile | 80.7 /100 | #146 | Excellent $55,954 |
| Immigrants | Philippines | 78.4 /100 | #147 | Good $55,809 |
| Scottish | 78.2 /100 | #148 | Good $55,793 |
| English | 77.4 /100 | #149 | Good $55,747 |
| Swiss | 77.1 /100 | #150 | Good $55,731 |
| Immigrants | Oceania | 76.8 /100 | #151 | Good $55,712 |
| Peruvians | 75.8 /100 | #152 | Good $55,659 |
| Immigrants | Nepal | 75.0 /100 | #153 | Good $55,615 |
| Taiwanese | 73.9 /100 | #154 | Good $55,556 |
| Scandinavians | 73.4 /100 | #155 | Good $55,527 |
| Immigrants | Ethiopia | 71.6 /100 | #156 | Good $55,434 |
| Icelanders | 71.2 /100 | #157 | Good $55,415 |