Pakistani vs Swedish Householder Income Over 65 years
COMPARE
Pakistani
Swedish
Householder Income Over 65 years
Householder Income Over 65 years Comparison
Pakistanis
Swedes
$63,844
HOUSEHOLDER INCOME OVER 65 YEARS
95.3/ 100
METRIC RATING
107th/ 347
METRIC RANK
$62,736
HOUSEHOLDER INCOME OVER 65 YEARS
86.4/ 100
METRIC RATING
127th/ 347
METRIC RANK
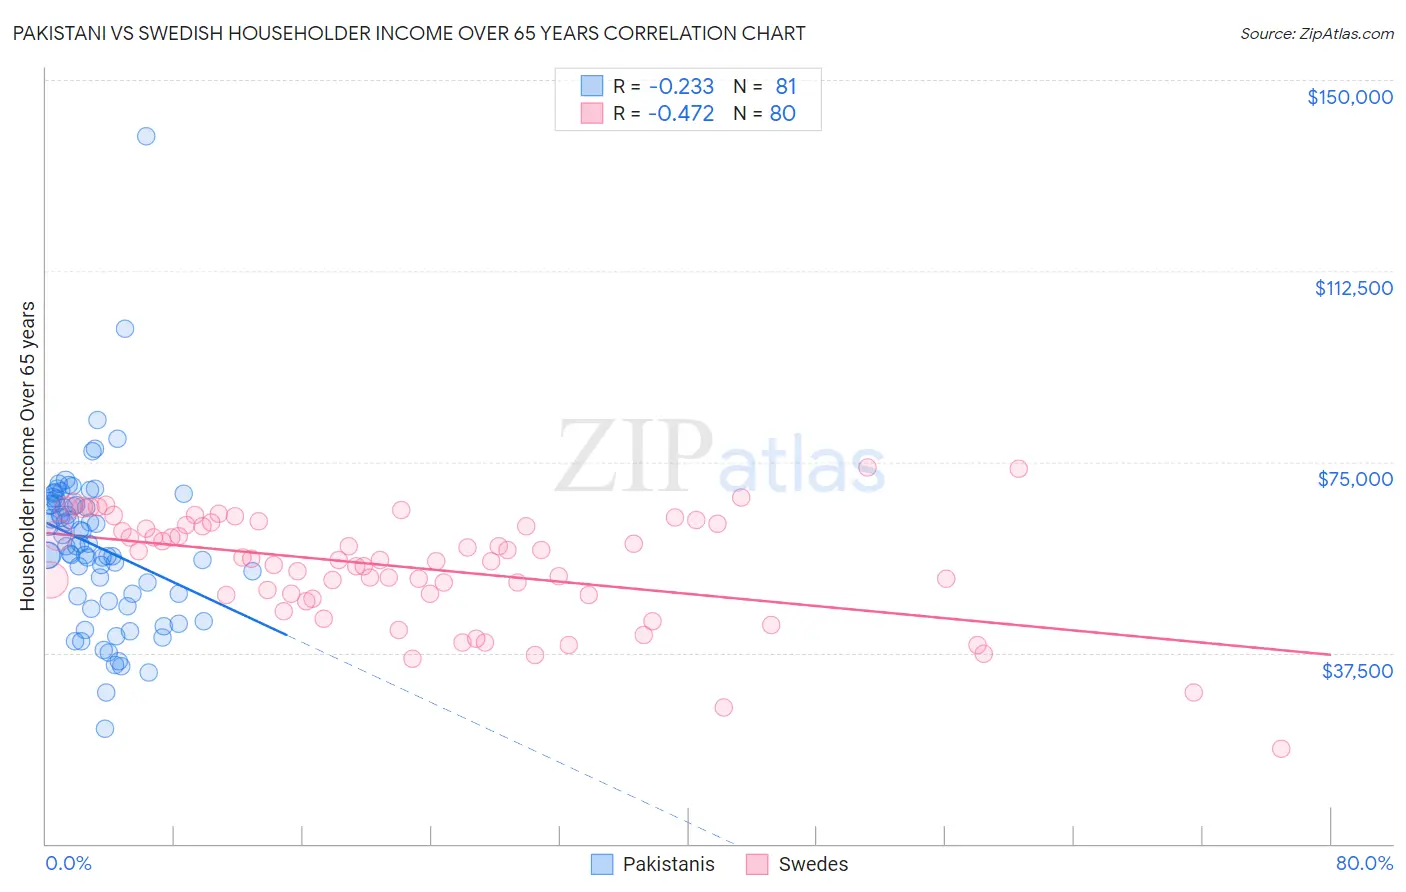
Pakistani vs Swedish Householder Income Over 65 years Correlation Chart
The statistical analysis conducted on geographies consisting of 334,349,406 people shows a weak negative correlation between the proportion of Pakistanis and household income with householder over the age of 65 in the United States with a correlation coefficient (R) of -0.233 and weighted average of $63,844. Similarly, the statistical analysis conducted on geographies consisting of 535,443,015 people shows a moderate negative correlation between the proportion of Swedes and household income with householder over the age of 65 in the United States with a correlation coefficient (R) of -0.472 and weighted average of $62,736, a difference of 1.8%.
Householder Income Over 65 years Correlation Summary
| Measurement | Pakistani | Swedish |
| Minimum | $22,611 | $18,625 |
| Maximum | $139,000 | $73,958 |
| Range | $116,389 | $55,333 |
| Mean | $58,427 | $54,196 |
| Median | $58,443 | $55,741 |
| Interquartile 25% (IQ1) | $48,104 | $48,778 |
| Interquartile 75% (IQ3) | $66,893 | $62,473 |
| Interquartile Range (IQR) | $18,789 | $13,695 |
| Standard Deviation (Sample) | $16,214 | $10,707 |
| Standard Deviation (Population) | $16,114 | $10,640 |
Demographics Similar to Pakistanis and Swedes by Householder Income Over 65 years
In terms of householder income over 65 years, the demographic groups most similar to Pakistanis are Palestinian ($63,800, a difference of 0.070%), European ($63,779, a difference of 0.10%), Immigrants from Zimbabwe ($63,643, a difference of 0.32%), Immigrants from Spain ($63,540, a difference of 0.48%), and Syrian ($63,494, a difference of 0.55%). Similarly, the demographic groups most similar to Swedes are Peruvian ($62,766, a difference of 0.050%), Soviet Union ($62,848, a difference of 0.18%), Taiwanese ($62,894, a difference of 0.25%), Tlingit-Haida ($62,922, a difference of 0.30%), and Immigrants from Moldova ($62,939, a difference of 0.32%).
| Demographics | Rating | Rank | Householder Income Over 65 years |
| Pakistanis | 95.3 /100 | #107 | Exceptional $63,844 |
| Palestinians | 95.1 /100 | #108 | Exceptional $63,800 |
| Europeans | 95.0 /100 | #109 | Exceptional $63,779 |
| Immigrants | Zimbabwe | 94.3 /100 | #110 | Exceptional $63,643 |
| Immigrants | Spain | 93.7 /100 | #111 | Exceptional $63,540 |
| Syrians | 93.4 /100 | #112 | Exceptional $63,494 |
| Immigrants | Serbia | 92.7 /100 | #113 | Exceptional $63,387 |
| Immigrants | Saudi Arabia | 92.4 /100 | #114 | Exceptional $63,355 |
| Croatians | 91.4 /100 | #115 | Exceptional $63,225 |
| Guamanians/Chamorros | 91.1 /100 | #116 | Exceptional $63,187 |
| Immigrants | Croatia | 90.9 /100 | #117 | Exceptional $63,168 |
| Danes | 90.5 /100 | #118 | Exceptional $63,117 |
| Immigrants | Jordan | 89.8 /100 | #119 | Excellent $63,041 |
| Ukrainians | 89.7 /100 | #120 | Excellent $63,032 |
| Immigrants | Vietnam | 89.5 /100 | #121 | Excellent $63,014 |
| Immigrants | Moldova | 88.7 /100 | #122 | Excellent $62,939 |
| Tlingit-Haida | 88.6 /100 | #123 | Excellent $62,922 |
| Taiwanese | 88.3 /100 | #124 | Excellent $62,894 |
| Soviet Union | 87.8 /100 | #125 | Excellent $62,848 |
| Peruvians | 86.8 /100 | #126 | Excellent $62,766 |
| Swedes | 86.4 /100 | #127 | Excellent $62,736 |