Paiute vs Immigrants from Eastern Europe Householder Income Ages 25 - 44 years
COMPARE
Paiute
Immigrants from Eastern Europe
Householder Income Ages 25 - 44 years
Householder Income Ages 25 - 44 years Comparison
Paiute
Immigrants from Eastern Europe
$82,984
HOUSEHOLDER INCOME AGES 25 - 44 YEARS
0.2/ 100
METRIC RATING
277th/ 347
METRIC RANK
$104,662
HOUSEHOLDER INCOME AGES 25 - 44 YEARS
99.6/ 100
METRIC RATING
68th/ 347
METRIC RANK
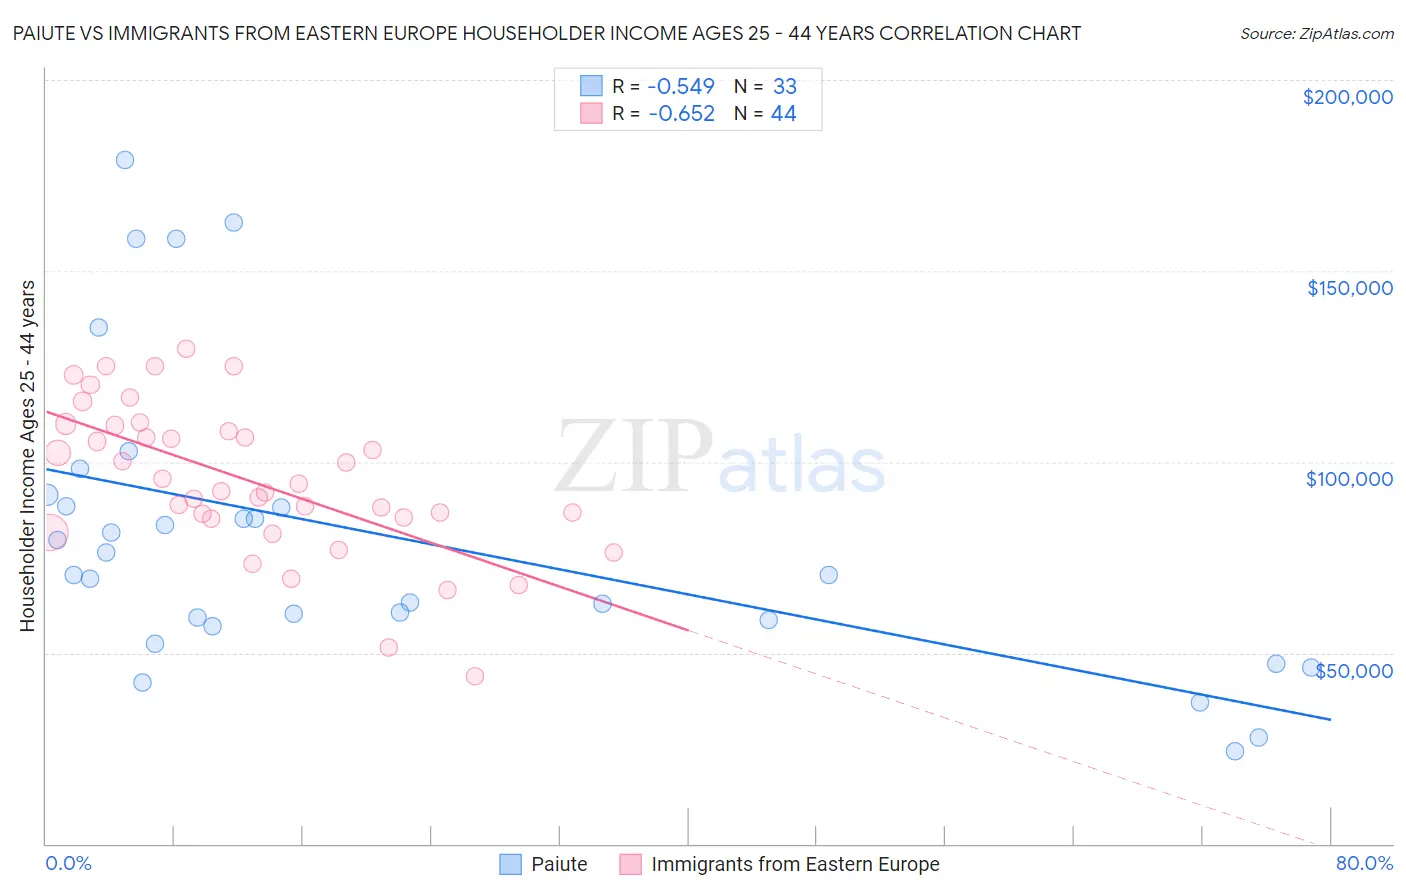
Paiute vs Immigrants from Eastern Europe Householder Income Ages 25 - 44 years Correlation Chart
The statistical analysis conducted on geographies consisting of 58,335,630 people shows a substantial negative correlation between the proportion of Paiute and household income with householder between the ages 25 and 44 in the United States with a correlation coefficient (R) of -0.549 and weighted average of $82,984. Similarly, the statistical analysis conducted on geographies consisting of 473,985,258 people shows a significant negative correlation between the proportion of Immigrants from Eastern Europe and household income with householder between the ages 25 and 44 in the United States with a correlation coefficient (R) of -0.652 and weighted average of $104,662, a difference of 26.1%.
Householder Income Ages 25 - 44 years Correlation Summary
| Measurement | Paiute | Immigrants from Eastern Europe |
| Minimum | $24,091 | $43,724 |
| Maximum | $179,063 | $129,765 |
| Range | $154,972 | $86,041 |
| Mean | $80,693 | $95,165 |
| Median | $70,417 | $93,230 |
| Interquartile 25% (IQ1) | $57,886 | $85,360 |
| Interquartile 75% (IQ3) | $89,878 | $108,718 |
| Interquartile Range (IQR) | $31,992 | $23,358 |
| Standard Deviation (Sample) | $38,861 | $19,648 |
| Standard Deviation (Population) | $38,267 | $19,424 |
Similar Demographics by Householder Income Ages 25 - 44 years
Demographics Similar to Paiute by Householder Income Ages 25 - 44 years
In terms of householder income ages 25 - 44 years, the demographic groups most similar to Paiute are Senegalese ($82,852, a difference of 0.16%), Immigrants from Belize ($83,141, a difference of 0.19%), Pima ($82,821, a difference of 0.20%), Immigrants from Jamaica ($83,298, a difference of 0.38%), and Colville ($82,604, a difference of 0.46%).
| Demographics | Rating | Rank | Householder Income Ages 25 - 44 years |
| Jamaicans | 0.3 /100 | #270 | Tragic $83,933 |
| Somalis | 0.2 /100 | #271 | Tragic $83,752 |
| Spanish Americans | 0.2 /100 | #272 | Tragic $83,722 |
| Iroquois | 0.2 /100 | #273 | Tragic $83,682 |
| Marshallese | 0.2 /100 | #274 | Tragic $83,575 |
| Immigrants | Jamaica | 0.2 /100 | #275 | Tragic $83,298 |
| Immigrants | Belize | 0.2 /100 | #276 | Tragic $83,141 |
| Paiute | 0.2 /100 | #277 | Tragic $82,984 |
| Senegalese | 0.2 /100 | #278 | Tragic $82,852 |
| Pima | 0.1 /100 | #279 | Tragic $82,821 |
| Colville | 0.1 /100 | #280 | Tragic $82,604 |
| Cajuns | 0.1 /100 | #281 | Tragic $82,393 |
| Central American Indians | 0.1 /100 | #282 | Tragic $82,355 |
| Guatemalans | 0.1 /100 | #283 | Tragic $82,331 |
| Immigrants | Middle Africa | 0.1 /100 | #284 | Tragic $82,254 |
Demographics Similar to Immigrants from Eastern Europe by Householder Income Ages 25 - 44 years
In terms of householder income ages 25 - 44 years, the demographic groups most similar to Immigrants from Eastern Europe are Immigrants from Romania ($104,713, a difference of 0.050%), Mongolian ($104,578, a difference of 0.080%), Immigrants from Croatia ($104,503, a difference of 0.15%), Afghan ($104,410, a difference of 0.24%), and Laotian ($104,993, a difference of 0.32%).
| Demographics | Rating | Rank | Householder Income Ages 25 - 44 years |
| Lithuanians | 99.7 /100 | #61 | Exceptional $105,223 |
| Immigrants | Italy | 99.7 /100 | #62 | Exceptional $105,201 |
| Immigrants | Scotland | 99.7 /100 | #63 | Exceptional $105,089 |
| New Zealanders | 99.7 /100 | #64 | Exceptional $105,085 |
| Immigrants | Netherlands | 99.7 /100 | #65 | Exceptional $105,082 |
| Laotians | 99.7 /100 | #66 | Exceptional $104,993 |
| Immigrants | Romania | 99.6 /100 | #67 | Exceptional $104,713 |
| Immigrants | Eastern Europe | 99.6 /100 | #68 | Exceptional $104,662 |
| Mongolians | 99.6 /100 | #69 | Exceptional $104,578 |
| Immigrants | Croatia | 99.6 /100 | #70 | Exceptional $104,503 |
| Afghans | 99.6 /100 | #71 | Exceptional $104,410 |
| Chinese | 99.5 /100 | #72 | Exceptional $104,264 |
| Italians | 99.5 /100 | #73 | Exceptional $104,215 |
| Immigrants | Fiji | 99.5 /100 | #74 | Exceptional $103,954 |
| Koreans | 99.4 /100 | #75 | Exceptional $103,824 |