Ottawa vs Crow Householder Income Under 25 years
COMPARE
Ottawa
Crow
Householder Income Under 25 years
Householder Income Under 25 years Comparison
Ottawa
Crow
$47,366
HOUSEHOLDER INCOME UNDER 25 YEARS
0.0/ 100
METRIC RATING
311th/ 347
METRIC RANK
$47,012
HOUSEHOLDER INCOME UNDER 25 YEARS
0.0/ 100
METRIC RATING
315th/ 347
METRIC RANK
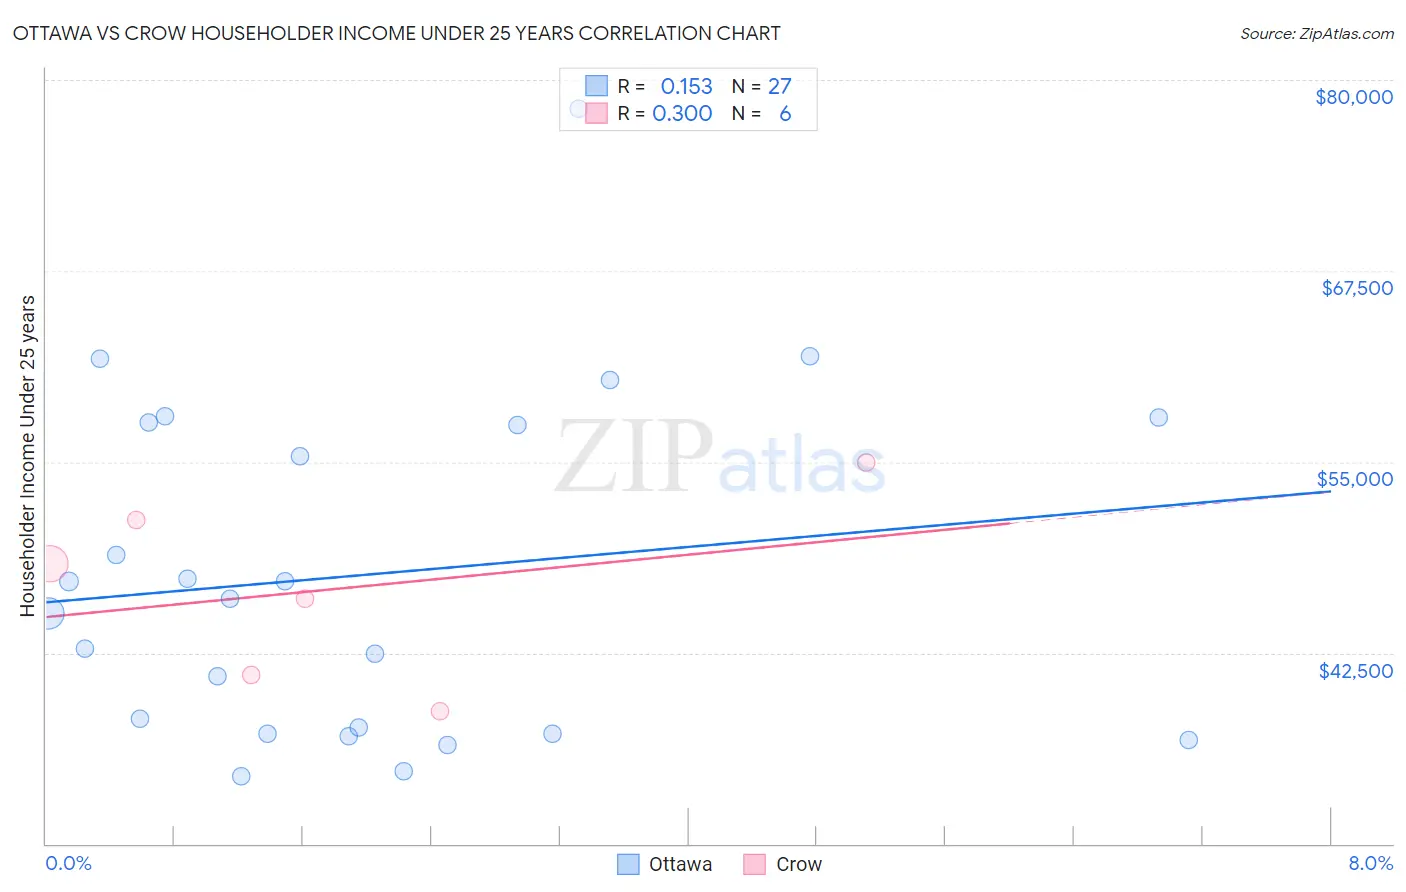
Ottawa vs Crow Householder Income Under 25 years Correlation Chart
The statistical analysis conducted on geographies consisting of 47,461,355 people shows a poor positive correlation between the proportion of Ottawa and household income with householder under the age of 25 in the United States with a correlation coefficient (R) of 0.153 and weighted average of $47,366. Similarly, the statistical analysis conducted on geographies consisting of 57,021,260 people shows a mild positive correlation between the proportion of Crow and household income with householder under the age of 25 in the United States with a correlation coefficient (R) of 0.300 and weighted average of $47,012, a difference of 0.75%.
Householder Income Under 25 years Correlation Summary
| Measurement | Ottawa | Crow |
| Minimum | $34,394 | $38,660 |
| Maximum | $78,125 | $55,000 |
| Range | $43,731 | $16,340 |
| Mean | $47,623 | $46,718 |
| Median | $46,012 | $47,186 |
| Interquartile 25% (IQ1) | $37,201 | $41,057 |
| Interquartile 75% (IQ3) | $57,615 | $51,221 |
| Interquartile Range (IQR) | $20,414 | $10,164 |
| Standard Deviation (Sample) | $11,046 | $6,149 |
| Standard Deviation (Population) | $10,839 | $5,613 |
Demographics Similar to Ottawa and Crow by Householder Income Under 25 years
In terms of householder income under 25 years, the demographic groups most similar to Ottawa are Bermudan ($47,359, a difference of 0.010%), Iroquois ($47,380, a difference of 0.030%), U.S. Virgin Islander ($47,448, a difference of 0.17%), Comanche ($47,518, a difference of 0.32%), and Delaware ($47,159, a difference of 0.44%). Similarly, the demographic groups most similar to Crow are Chippewa ($47,015, a difference of 0.010%), Sudanese ($46,982, a difference of 0.060%), Hopi ($46,978, a difference of 0.070%), Spanish American ($46,913, a difference of 0.21%), and Delaware ($47,159, a difference of 0.31%).
| Demographics | Rating | Rank | Householder Income Under 25 years |
| Immigrants | Middle Africa | 0.0 /100 | #303 | Tragic $47,916 |
| Menominee | 0.0 /100 | #304 | Tragic $47,907 |
| Cherokee | 0.0 /100 | #305 | Tragic $47,848 |
| Natives/Alaskans | 0.0 /100 | #306 | Tragic $47,704 |
| Bangladeshis | 0.0 /100 | #307 | Tragic $47,589 |
| Comanche | 0.0 /100 | #308 | Tragic $47,518 |
| U.S. Virgin Islanders | 0.0 /100 | #309 | Tragic $47,448 |
| Iroquois | 0.0 /100 | #310 | Tragic $47,380 |
| Ottawa | 0.0 /100 | #311 | Tragic $47,366 |
| Bermudans | 0.0 /100 | #312 | Tragic $47,359 |
| Delaware | 0.0 /100 | #313 | Tragic $47,159 |
| Chippewa | 0.0 /100 | #314 | Tragic $47,015 |
| Crow | 0.0 /100 | #315 | Tragic $47,012 |
| Sudanese | 0.0 /100 | #316 | Tragic $46,982 |
| Hopi | 0.0 /100 | #317 | Tragic $46,978 |
| Spanish Americans | 0.0 /100 | #318 | Tragic $46,913 |
| Africans | 0.0 /100 | #319 | Tragic $46,838 |
| Immigrants | Sudan | 0.0 /100 | #320 | Tragic $46,791 |
| Potawatomi | 0.0 /100 | #321 | Tragic $46,462 |
| Sioux | 0.0 /100 | #322 | Tragic $46,417 |
| Immigrants | Saudi Arabia | 0.0 /100 | #323 | Tragic $46,187 |