Okinawan vs Osage Per Capita Income

COMPARE

Okinawan
Race
Ancestry
AfghanAfricanAlaska NativeAlaskan AthabascanAlbanianAleutAlsatianAmericanApacheArabArapahoArgentineanArmenianAssyrian/Chaldean/SyriacAustralianAustrianBahamianBangladeshiBarbadianBasqueBelgianBelizeanBermudanBhutaneseBlackfeetBolivianBrazilianBritishBritish West IndianBulgarianBurmeseCajunCambodianCanadianCape VerdeanCarpatho RusynCelticCentral AmericanCentral American IndianCherokeeCheyenneChickasawChileanChineseChippewaChoctawColombianColvilleComancheCosta RicanCreeCreekCroatianCrowCubanCypriotCzechCzechoslovakianDanishDelawareDominicanDutchDutch West IndianEastern EuropeanEcuadorianEgyptianEnglishEstonianEthiopianEuropeanFijianFilipinoFinnishFrenchFrench American IndianFrench CanadianGermanGerman RussianGhanaianGreekGuamanian/ChamorroGuatemalanGuyaneseHaitianHmongHonduranHopiHoumaHungarianIcelanderIndian (Asian)IndonesianInupiatIranianIraqiIrishIroquoisIsraeliItalianJamaicanJapaneseJordanianKenyanKiowaKoreanLaotianLatvianLebaneseLiberianLithuanianLumbeeLuxembourgerMacedonianMalaysianMalteseMarshalleseMenomineeMexicanMexican American IndianMongolianMoroccanNative HawaiianNavajoNepaleseNew ZealanderNicaraguanNigerianNorthern EuropeanNorwegianOkinawanOttawaPaiutePakistaniPalestinianPanamanianParaguayanPennsylvania GermanPeruvianPimaPolishPortuguesePotawatomiPuebloPuerto RicanPuget Sound SalishRomanianRussianSalvadoranSamoanScandinavianScotch-IrishScottishSeminoleSenegaleseSerbianShoshoneSierra LeoneanSiouxSlavicSlovakSloveneSomaliSouth AfricanSouth AmericanSouth American IndianSoviet UnionSpaniardSpanishSpanish AmericanSpanish American IndianSri LankanSubsaharan AfricanSudaneseSwedishSwissSyrianTaiwaneseThaiTlingit-HaidaTohono O'OdhamTonganTrinidadian and TobagonianTsimshianTurkishU.S. Virgin IslanderUgandanUkrainianUruguayanUteVenezuelanVietnameseWelshWest IndianYakamaYaquiYugoslavianYumanYup'ikZimbabwean
Immigration
NonimmigrantsImmigrantsAfghanistanAfricaAlbaniaArgentinaArmeniaAsiaAustraliaAustriaBahamasBangladeshBarbadosBelarusBelgiumBelizeBoliviaBosnia and HerzegovinaBrazilBulgariaBurma/MyanmarCabo VerdeCambodiaCameroonCanadaCaribbeanCentral AmericaChileChinaColombiaCongoCosta RicaCroatiaCubaCzechoslovakiaDenmarkDominicaDominican RepublicEastern AfricaEastern AsiaEastern EuropeEcuadorEgyptEl SalvadorEnglandEritreaEthiopiaEuropeFijiFranceGermanyGhanaGreeceGrenadaGuatemalaGuyanaHaitiHondurasHong KongHungaryIndiaIndonesiaIranIraqIrelandIsraelItalyJamaicaJapanJordanKazakhstanKenyaKoreaKuwaitLaosLatin AmericaLatviaLebanonLiberiaLithuaniaMalaysiaMexicoMicronesiaMiddle AfricaMoldovaMoroccoNepalNetherlandsNicaraguaNigeriaNorth AmericaNorth MacedoniaNorthern AfricaNorthern EuropeNorwayOceaniaPakistanPanamaPeruPhilippinesPolandPortugalRomaniaRussiaSaudi ArabiaScotlandSenegalSerbiaSierra LeoneSingaporeSomaliaSouth AfricaSouth AmericaSouth Central AsiaSouth Eastern AsiaSouthern EuropeSpainSri LankaSt. Vincent and the GrenadinesSudanSwedenSwitzerlandSyriaTaiwanThailandTrinidad and TobagoTurkeyUgandaUkraineUruguayUzbekistanVenezuelaVietnamWest IndiesWestern AfricaWestern AsiaWestern EuropeYemenZaireZimbabweAzores
Osage
Race
Ancestry
AfghanAfricanAlaska NativeAlaskan AthabascanAlbanianAleutAlsatianAmericanApacheArabArapahoArgentineanArmenianAssyrian/Chaldean/SyriacAustralianAustrianBahamianBangladeshiBarbadianBasqueBelgianBelizeanBermudanBhutaneseBlackfeetBolivianBrazilianBritishBritish West IndianBulgarianBurmeseCajunCambodianCanadianCape VerdeanCarpatho RusynCelticCentral AmericanCentral American IndianCherokeeCheyenneChickasawChileanChineseChippewaChoctawColombianColvilleComancheCosta RicanCreeCreekCroatianCrowCubanCypriotCzechCzechoslovakianDanishDelawareDominicanDutchDutch West IndianEastern EuropeanEcuadorianEgyptianEnglishEstonianEthiopianEuropeanFijianFilipinoFinnishFrenchFrench American IndianFrench CanadianGermanGerman RussianGhanaianGreekGuamanian/ChamorroGuatemalanGuyaneseHaitianHmongHonduranHopiHoumaHungarianIcelanderIndian (Asian)IndonesianInupiatIranianIraqiIrishIroquoisIsraeliItalianJamaicanJapaneseJordanianKenyanKiowaKoreanLaotianLatvianLebaneseLiberianLithuanianLumbeeLuxembourgerMacedonianMalaysianMalteseMarshalleseMenomineeMexicanMexican American IndianMongolianMoroccanNative HawaiianNavajoNepaleseNew ZealanderNicaraguanNigerianNorthern EuropeanNorwegianOsageOttawaPaiutePakistaniPalestinianPanamanianParaguayanPennsylvania GermanPeruvianPimaPolishPortuguesePotawatomiPuebloPuerto RicanPuget Sound SalishRomanianRussianSalvadoranSamoanScandinavianScotch-IrishScottishSeminoleSenegaleseSerbianShoshoneSierra LeoneanSiouxSlavicSlovakSloveneSomaliSouth AfricanSouth AmericanSouth American IndianSoviet UnionSpaniardSpanishSpanish AmericanSpanish American IndianSri LankanSubsaharan AfricanSudaneseSwedishSwissSyrianTaiwaneseThaiTlingit-HaidaTohono O'OdhamTonganTrinidadian and TobagonianTsimshianTurkishU.S. Virgin IslanderUgandanUkrainianUruguayanUteVenezuelanVietnameseWelshWest IndianYakamaYaquiYugoslavianYumanYup'ikZimbabwean
Immigration
NonimmigrantsImmigrantsAfghanistanAfricaAlbaniaArgentinaArmeniaAsiaAustraliaAustriaBahamasBangladeshBarbadosBelarusBelgiumBelizeBoliviaBosnia and HerzegovinaBrazilBulgariaBurma/MyanmarCabo VerdeCambodiaCameroonCanadaCaribbeanCentral AmericaChileChinaColombiaCongoCosta RicaCroatiaCubaCzechoslovakiaDenmarkDominicaDominican RepublicEastern AfricaEastern AsiaEastern EuropeEcuadorEgyptEl SalvadorEnglandEritreaEthiopiaEuropeFijiFranceGermanyGhanaGreeceGrenadaGuatemalaGuyanaHaitiHondurasHong KongHungaryIndiaIndonesiaIranIraqIrelandIsraelItalyJamaicaJapanJordanKazakhstanKenyaKoreaKuwaitLaosLatin AmericaLatviaLebanonLiberiaLithuaniaMalaysiaMexicoMicronesiaMiddle AfricaMoldovaMoroccoNepalNetherlandsNicaraguaNigeriaNorth AmericaNorth MacedoniaNorthern AfricaNorthern EuropeNorwayOceaniaPakistanPanamaPeruPhilippinesPolandPortugalRomaniaRussiaSaudi ArabiaScotlandSenegalSerbiaSierra LeoneSingaporeSomaliaSouth AfricaSouth AmericaSouth Central AsiaSouth Eastern AsiaSouthern EuropeSpainSri LankaSt. Vincent and the GrenadinesSudanSwedenSwitzerlandSyriaTaiwanThailandTrinidad and TobagoTurkeyUgandaUkraineUruguayUzbekistanVenezuelaVietnamWest IndiesWestern AfricaWestern AsiaWestern EuropeYemenZaireZimbabweAzores
Per Capita Income
Income
Poverty
Unemployment
Labor Participation
Family Structure
Vehicle Availability
Education Level
Disability

Per Capita Income Comparison

Okinawans

Osage

Exceptional
Tragic
$55,817
PER CAPITA INCOME
100.0/ 100
METRIC RATING
10th/ 347
METRIC RANK
$39,568
PER CAPITA INCOME
1.0/ 100
METRIC RATING
253rd/ 347
METRIC RANK

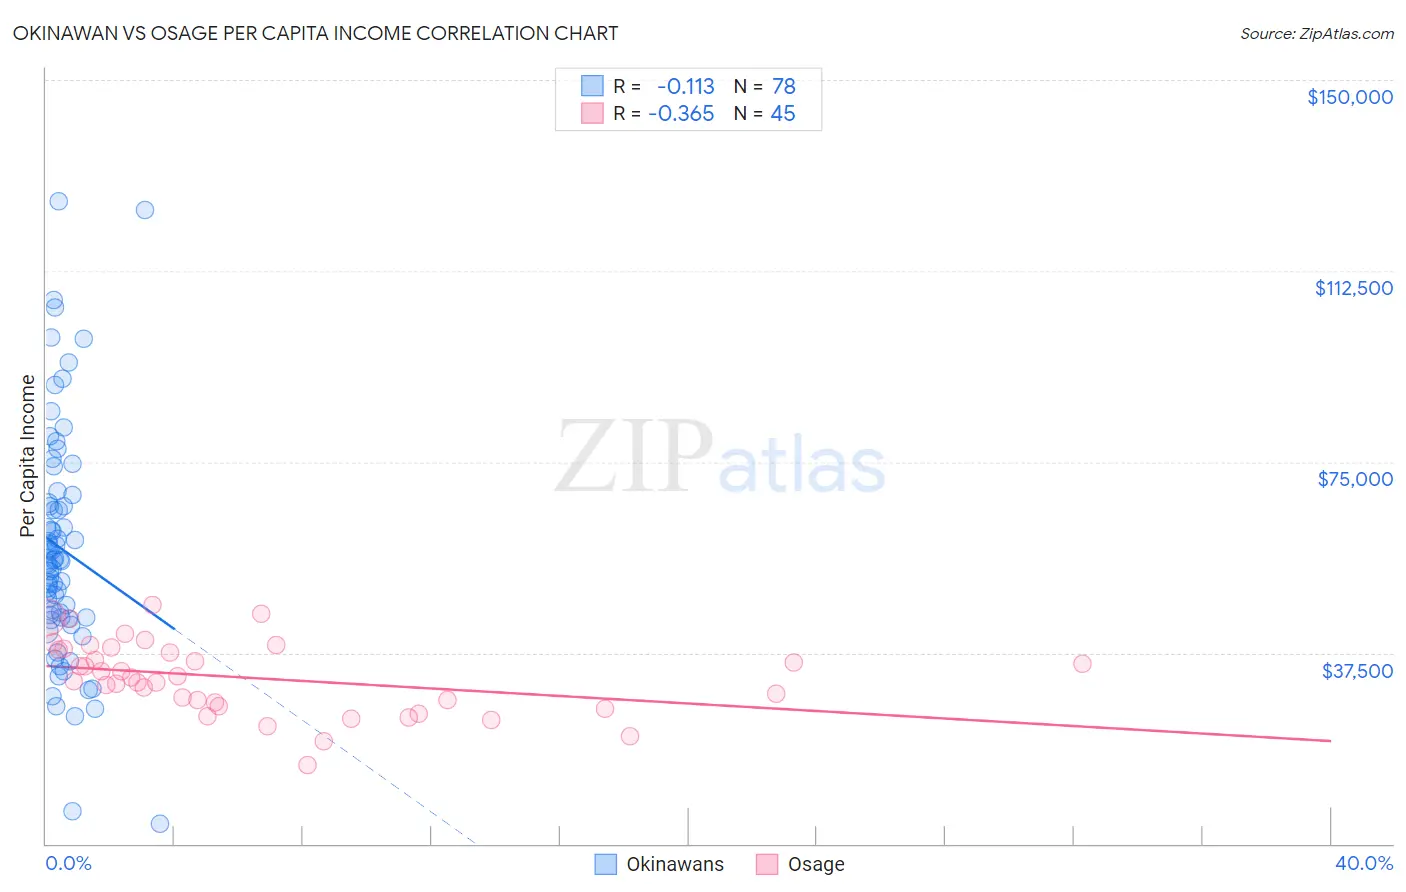
Okinawan vs Osage Per Capita Income Correlation Chart

The statistical analysis conducted on geographies consisting of 73,745,153 people shows a poor negative correlation between the proportion of Okinawans and per capita income in the United States with a correlation coefficient (R) of -0.113 and weighted average of $55,817. Similarly, the statistical analysis conducted on geographies consisting of 91,808,929 people shows a mild negative correlation between the proportion of Osage and per capita income in the United States with a correlation coefficient (R) of -0.365 and weighted average of $39,568, a difference of 41.1%.
Okinawan vs Osage Per Capita Income

Per Capita Income Correlation Summary

MeasurementOkinawanOsage
Minimum$4,017$15,396
Maximum$126,204$46,906
Range$122,187$31,510
Mean$57,948$32,578
Median$55,509$32,608
Interquartile 25% (IQ1)$44,396$27,395
Interquartile 75% (IQ3)$66,910$38,257
Interquartile Range (IQR)$22,513$10,862
Standard Deviation (Sample)$23,213$7,093
Standard Deviation (Population)$23,064$7,014

Similar Demographics by Per Capita Income

Demographics Similar to Okinawans by Per Capita Income

In terms of per capita income, the demographic groups most similar to Okinawans are Eastern European ($55,780, a difference of 0.070%), Immigrants from Sweden ($55,582, a difference of 0.42%), Immigrants from India ($55,268, a difference of 0.99%), Immigrants from Belgium ($55,082, a difference of 1.3%), and Immigrants from Ireland ($56,584, a difference of 1.4%).
DemographicsRating | RankPer Capita Income
Immigrants | Singapore
100.0
/100
|
#3
Exceptional
$58,353
Immigrants | Australia
100.0
/100
|
#4
Exceptional
$57,953
Immigrants | Iran
100.0
/100
|
#5
Exceptional
$57,759
Immigrants | Taiwan
100.0
/100
|
#6
Exceptional
$57,742
Immigrants | Israel
100.0
/100
|
#7
Exceptional
$57,384
Immigrants | Hong Kong
100.0
/100
|
#8
Exceptional
$56,709
Immigrants | Ireland
100.0
/100
|
#9
Exceptional
$56,584
Okinawans
100.0
/100
|
#10
Exceptional
$55,817
Eastern Europeans
100.0
/100
|
#11
Exceptional
$55,780
Immigrants | Sweden
100.0
/100
|
#12
Exceptional
$55,582
Immigrants | India
100.0
/100
|
#13
Exceptional
$55,268
Immigrants | Belgium
100.0
/100
|
#14
Exceptional
$55,082
Cypriots
100.0
/100
|
#15
Exceptional
$54,899
Immigrants | Switzerland
100.0
/100
|
#16
Exceptional
$54,866
Immigrants | France
100.0
/100
|
#17
Exceptional
$54,557

Demographics Similar to Osage by Per Capita Income

In terms of per capita income, the demographic groups most similar to Osage are Alaska Native ($39,558, a difference of 0.020%), Immigrants from the Azores ($39,608, a difference of 0.10%), Immigrants from Middle Africa ($39,529, a difference of 0.10%), Hawaiian ($39,403, a difference of 0.42%), and Nicaraguan ($39,372, a difference of 0.50%).
DemographicsRating | RankPer Capita Income
Cree
1.7
/100
|
#246
Tragic
$40,056
Immigrants | Somalia
1.6
/100
|
#247
Tragic
$39,974
Cape Verdeans
1.5
/100
|
#248
Tragic
$39,935
Japanese
1.4
/100
|
#249
Tragic
$39,870
Immigrants | Burma/Myanmar
1.3
/100
|
#250
Tragic
$39,827
Samoans
1.3
/100
|
#251
Tragic
$39,826
Immigrants | Azores
1.0
/100
|
#252
Tragic
$39,608
Osage
1.0
/100
|
#253
Tragic
$39,568
Alaska Natives
1.0
/100
|
#254
Tragic
$39,558
Immigrants | Middle Africa
1.0
/100
|
#255
Tragic
$39,529
Hawaiians
0.8
/100
|
#256
Tragic
$39,403
Nicaraguans
0.8
/100
|
#257
Tragic
$39,372
Jamaicans
0.7
/100
|
#258
Tragic
$39,231
Malaysians
0.7
/100
|
#259
Tragic
$39,194
Alaskan Athabascans
0.6
/100
|
#260
Tragic
$39,163