Okinawan vs Immigrants from Ireland Median Male Earnings
COMPARE
Okinawan
Immigrants from Ireland
Median Male Earnings
Median Male Earnings Comparison
Okinawans
Immigrants from Ireland
$67,232
MEDIAN MALE EARNINGS
100.0/ 100
METRIC RATING
14th/ 347
METRIC RANK
$67,698
MEDIAN MALE EARNINGS
100.0/ 100
METRIC RATING
11th/ 347
METRIC RANK
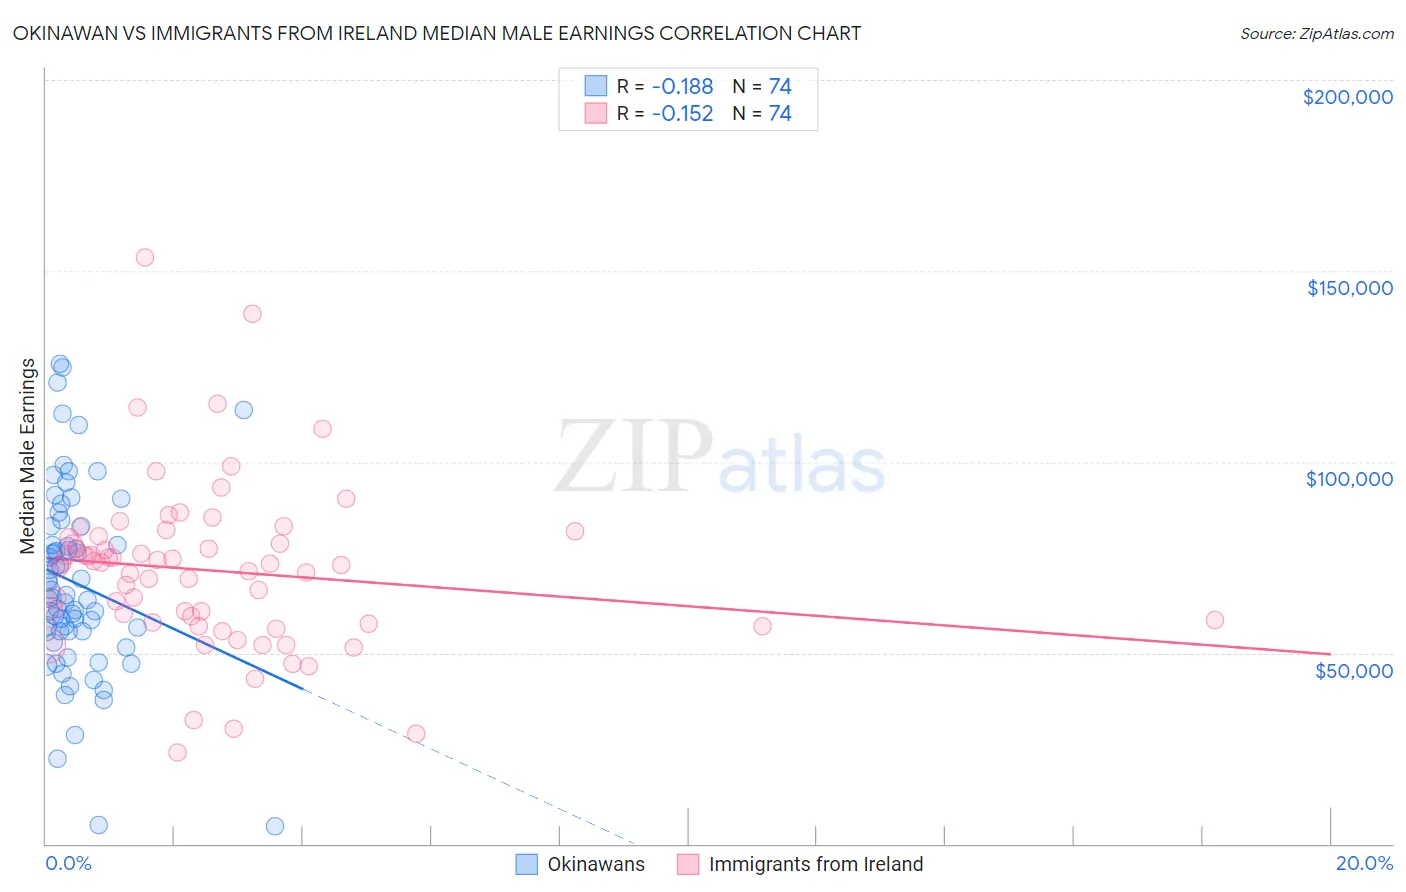
Okinawan vs Immigrants from Ireland Median Male Earnings Correlation Chart
The statistical analysis conducted on geographies consisting of 73,732,782 people shows a poor negative correlation between the proportion of Okinawans and median male earnings in the United States with a correlation coefficient (R) of -0.188 and weighted average of $67,232. Similarly, the statistical analysis conducted on geographies consisting of 240,726,887 people shows a poor negative correlation between the proportion of Immigrants from Ireland and median male earnings in the United States with a correlation coefficient (R) of -0.152 and weighted average of $67,698, a difference of 0.69%.
Median Male Earnings Correlation Summary
| Measurement | Okinawan | Immigrants from Ireland |
| Minimum | $4,698 | $23,924 |
| Maximum | $125,733 | $153,576 |
| Range | $121,035 | $129,652 |
| Mean | $68,280 | $71,558 |
| Median | $64,869 | $73,213 |
| Interquartile 25% (IQ1) | $55,642 | $58,076 |
| Interquartile 75% (IQ3) | $83,017 | $80,238 |
| Interquartile Range (IQR) | $27,375 | $22,162 |
| Standard Deviation (Sample) | $24,436 | $21,669 |
| Standard Deviation (Population) | $24,270 | $21,523 |
Demographics Similar to Okinawans and Immigrants from Ireland by Median Male Earnings
In terms of median male earnings, the demographic groups most similar to Okinawans are Immigrants from China ($67,353, a difference of 0.18%), Immigrants from Eastern Asia ($66,903, a difference of 0.49%), Immigrants from Australia ($67,634, a difference of 0.60%), Eastern European ($66,472, a difference of 1.1%), and Immigrants from Belgium ($66,125, a difference of 1.7%). Similarly, the demographic groups most similar to Immigrants from Ireland are Immigrants from Australia ($67,634, a difference of 0.090%), Immigrants from China ($67,353, a difference of 0.51%), Immigrants from Eastern Asia ($66,903, a difference of 1.2%), Immigrants from Israel ($68,716, a difference of 1.5%), and Eastern European ($66,472, a difference of 1.8%).
| Demographics | Rating | Rank | Median Male Earnings |
| Immigrants | India | 100.0 /100 | #2 | Exceptional $74,207 |
| Immigrants | Taiwan | 100.0 /100 | #3 | Exceptional $74,031 |
| Thais | 100.0 /100 | #4 | Exceptional $72,135 |
| Immigrants | Singapore | 100.0 /100 | #5 | Exceptional $71,348 |
| Iranians | 100.0 /100 | #6 | Exceptional $70,648 |
| Immigrants | Hong Kong | 100.0 /100 | #7 | Exceptional $70,146 |
| Immigrants | Iran | 100.0 /100 | #8 | Exceptional $69,284 |
| Immigrants | South Central Asia | 100.0 /100 | #9 | Exceptional $68,960 |
| Immigrants | Israel | 100.0 /100 | #10 | Exceptional $68,716 |
| Immigrants | Ireland | 100.0 /100 | #11 | Exceptional $67,698 |
| Immigrants | Australia | 100.0 /100 | #12 | Exceptional $67,634 |
| Immigrants | China | 100.0 /100 | #13 | Exceptional $67,353 |
| Okinawans | 100.0 /100 | #14 | Exceptional $67,232 |
| Immigrants | Eastern Asia | 100.0 /100 | #15 | Exceptional $66,903 |
| Eastern Europeans | 100.0 /100 | #16 | Exceptional $66,472 |
| Immigrants | Belgium | 100.0 /100 | #17 | Exceptional $66,125 |
| Indians (Asian) | 100.0 /100 | #18 | Exceptional $66,078 |
| Cypriots | 100.0 /100 | #19 | Exceptional $65,549 |
| Immigrants | Japan | 100.0 /100 | #20 | Exceptional $65,518 |
| Immigrants | Sweden | 100.0 /100 | #21 | Exceptional $65,406 |
| Burmese | 100.0 /100 | #22 | Exceptional $65,236 |