Norwegian vs South African Per Capita Income
COMPARE
Norwegian
South African
Per Capita Income
Per Capita Income Comparison
Norwegians
South Africans
$44,480
PER CAPITA INCOME
71.5/ 100
METRIC RATING
151st/ 347
METRIC RANK
$50,044
PER CAPITA INCOME
99.9/ 100
METRIC RATING
57th/ 347
METRIC RANK
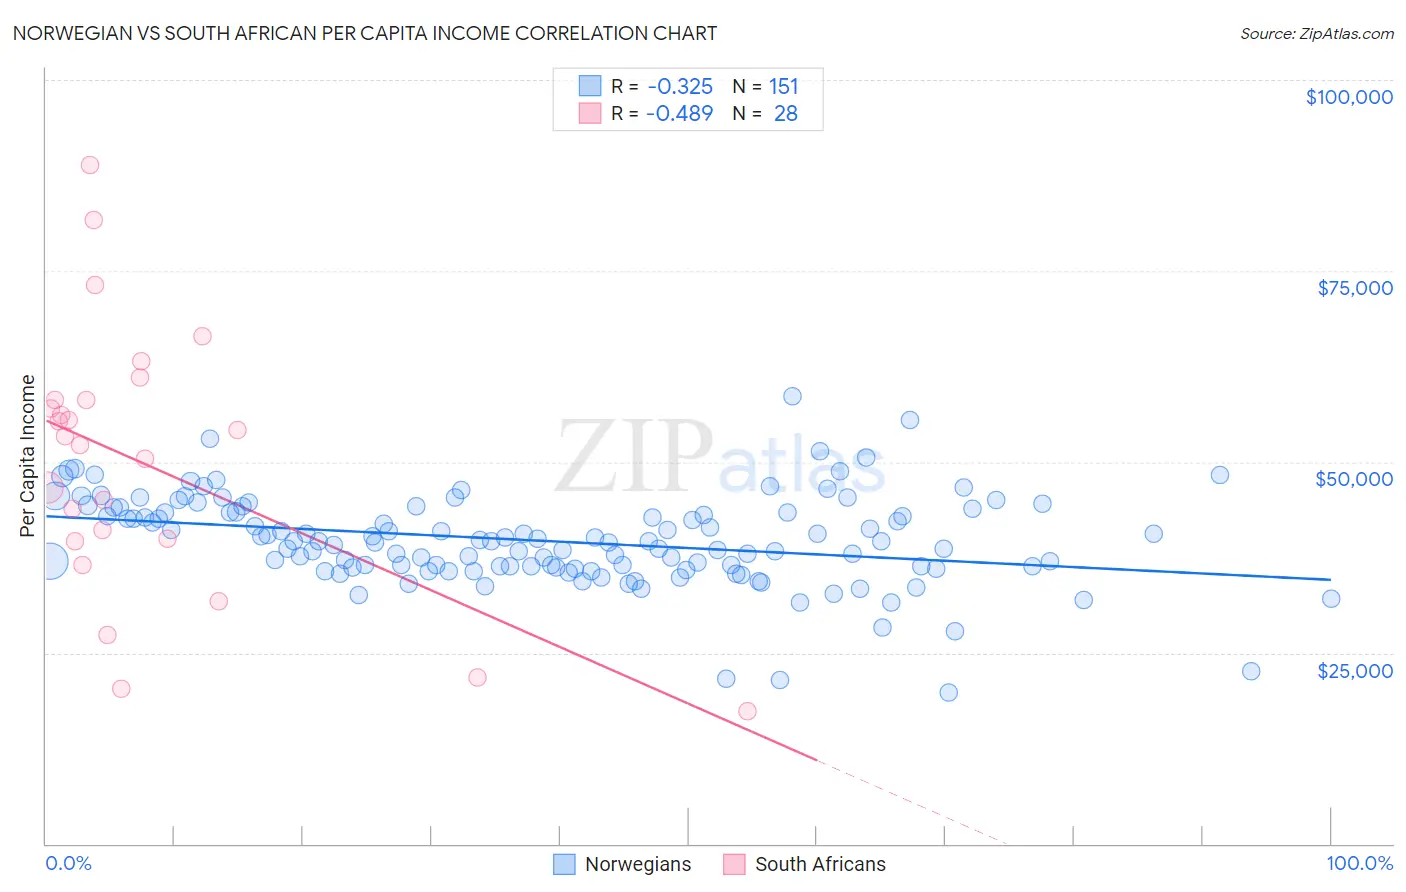
Norwegian vs South African Per Capita Income Correlation Chart
The statistical analysis conducted on geographies consisting of 533,432,025 people shows a mild negative correlation between the proportion of Norwegians and per capita income in the United States with a correlation coefficient (R) of -0.325 and weighted average of $44,480. Similarly, the statistical analysis conducted on geographies consisting of 182,604,546 people shows a moderate negative correlation between the proportion of South Africans and per capita income in the United States with a correlation coefficient (R) of -0.489 and weighted average of $50,044, a difference of 12.5%.
Per Capita Income Correlation Summary
| Measurement | Norwegian | South African |
| Minimum | $19,862 | $17,364 |
| Maximum | $58,625 | $88,818 |
| Range | $38,763 | $71,454 |
| Mean | $39,667 | $49,855 |
| Median | $39,585 | $52,728 |
| Interquartile 25% (IQ1) | $36,106 | $39,824 |
| Interquartile 75% (IQ3) | $43,454 | $58,137 |
| Interquartile Range (IQR) | $7,348 | $18,313 |
| Standard Deviation (Sample) | $5,967 | $17,281 |
| Standard Deviation (Population) | $5,947 | $16,970 |
Similar Demographics by Per Capita Income
Demographics Similar to Norwegians by Per Capita Income
In terms of per capita income, the demographic groups most similar to Norwegians are Peruvian ($44,479, a difference of 0.0%), Immigrants from Eritrea ($44,509, a difference of 0.060%), Scottish ($44,440, a difference of 0.090%), Korean ($44,522, a difference of 0.10%), and Immigrants from Armenia ($44,552, a difference of 0.16%).
| Demographics | Rating | Rank | Per Capita Income |
| Icelanders | 81.6 /100 | #144 | Excellent $44,987 |
| Immigrants | Afghanistan | 78.0 /100 | #145 | Good $44,790 |
| Irish | 75.8 /100 | #146 | Good $44,679 |
| Czechs | 74.1 /100 | #147 | Good $44,595 |
| Immigrants | Armenia | 73.1 /100 | #148 | Good $44,552 |
| Koreans | 72.5 /100 | #149 | Good $44,522 |
| Immigrants | Eritrea | 72.1 /100 | #150 | Good $44,509 |
| Norwegians | 71.5 /100 | #151 | Good $44,480 |
| Peruvians | 71.5 /100 | #152 | Good $44,479 |
| Scottish | 70.6 /100 | #153 | Good $44,440 |
| Portuguese | 68.7 /100 | #154 | Good $44,362 |
| Uruguayans | 67.6 /100 | #155 | Good $44,318 |
| Slovaks | 65.4 /100 | #156 | Good $44,229 |
| South American Indians | 64.8 /100 | #157 | Good $44,206 |
| Immigrants | Nepal | 64.3 /100 | #158 | Good $44,187 |
Demographics Similar to South Africans by Per Capita Income
In terms of per capita income, the demographic groups most similar to South Africans are Asian ($50,057, a difference of 0.030%), Immigrants from Western Europe ($50,065, a difference of 0.040%), Immigrants from Malaysia ($49,983, a difference of 0.12%), Bhutanese ($49,894, a difference of 0.30%), and Immigrants from Scotland ($49,893, a difference of 0.30%).
| Demographics | Rating | Rank | Per Capita Income |
| Immigrants | Sri Lanka | 100.0 /100 | #50 | Exceptional $50,555 |
| Immigrants | Netherlands | 100.0 /100 | #51 | Exceptional $50,458 |
| Immigrants | Croatia | 99.9 /100 | #52 | Exceptional $50,417 |
| Paraguayans | 99.9 /100 | #53 | Exceptional $50,385 |
| Immigrants | Belarus | 99.9 /100 | #54 | Exceptional $50,303 |
| Immigrants | Western Europe | 99.9 /100 | #55 | Exceptional $50,065 |
| Asians | 99.9 /100 | #56 | Exceptional $50,057 |
| South Africans | 99.9 /100 | #57 | Exceptional $50,044 |
| Immigrants | Malaysia | 99.9 /100 | #58 | Exceptional $49,983 |
| Bhutanese | 99.9 /100 | #59 | Exceptional $49,894 |
| Immigrants | Scotland | 99.9 /100 | #60 | Exceptional $49,893 |
| Argentineans | 99.9 /100 | #61 | Exceptional $49,862 |
| Immigrants | Asia | 99.9 /100 | #62 | Exceptional $49,741 |
| Maltese | 99.9 /100 | #63 | Exceptional $49,640 |
| Immigrants | Argentina | 99.9 /100 | #64 | Exceptional $49,627 |