Northern European vs Immigrants from Syria Per Capita Income
COMPARE
Northern European
Immigrants from Syria
Per Capita Income
Per Capita Income Comparison
Northern Europeans
Immigrants from Syria
$47,698
PER CAPITA INCOME
98.9/ 100
METRIC RATING
89th/ 347
METRIC RANK
$45,218
PER CAPITA INCOME
85.2/ 100
METRIC RATING
137th/ 347
METRIC RANK
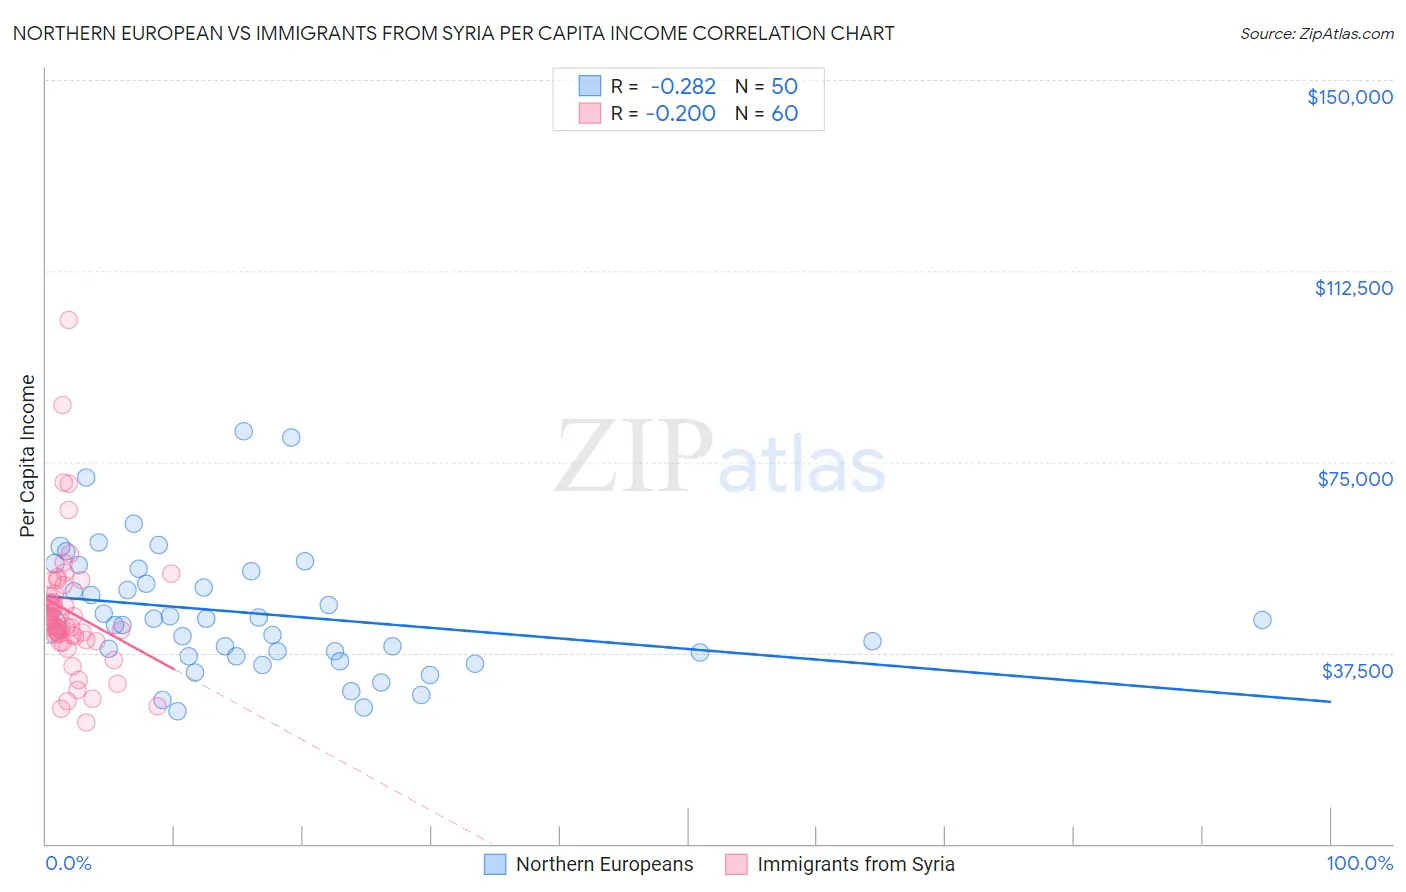
Northern European vs Immigrants from Syria Per Capita Income Correlation Chart
The statistical analysis conducted on geographies consisting of 406,105,495 people shows a weak negative correlation between the proportion of Northern Europeans and per capita income in the United States with a correlation coefficient (R) of -0.282 and weighted average of $47,698. Similarly, the statistical analysis conducted on geographies consisting of 174,111,110 people shows a poor negative correlation between the proportion of Immigrants from Syria and per capita income in the United States with a correlation coefficient (R) of -0.200 and weighted average of $45,218, a difference of 5.5%.
Per Capita Income Correlation Summary
| Measurement | Northern European | Immigrants from Syria |
| Minimum | $26,062 | $23,901 |
| Maximum | $80,940 | $102,814 |
| Range | $54,878 | $78,913 |
| Mean | $45,254 | $45,572 |
| Median | $43,430 | $43,422 |
| Interquartile 25% (IQ1) | $36,923 | $40,433 |
| Interquartile 75% (IQ3) | $53,441 | $48,863 |
| Interquartile Range (IQR) | $16,518 | $8,430 |
| Standard Deviation (Sample) | $12,375 | $13,127 |
| Standard Deviation (Population) | $12,250 | $13,017 |
Similar Demographics by Per Capita Income
Demographics Similar to Northern Europeans by Per Capita Income
In terms of per capita income, the demographic groups most similar to Northern Europeans are Croatian ($47,742, a difference of 0.090%), Italian ($47,574, a difference of 0.26%), Macedonian ($47,573, a difference of 0.26%), Immigrants from Moldova ($47,489, a difference of 0.44%), and Immigrants from Zimbabwe ($47,394, a difference of 0.64%).
| Demographics | Rating | Rank | Per Capita Income |
| Immigrants | Indonesia | 99.4 /100 | #82 | Exceptional $48,195 |
| Immigrants | Brazil | 99.4 /100 | #83 | Exceptional $48,164 |
| Immigrants | Ukraine | 99.3 /100 | #84 | Exceptional $48,134 |
| Austrians | 99.3 /100 | #85 | Exceptional $48,116 |
| Immigrants | Southern Europe | 99.3 /100 | #86 | Exceptional $48,027 |
| Ukrainians | 99.3 /100 | #87 | Exceptional $48,014 |
| Croatians | 99.0 /100 | #88 | Exceptional $47,742 |
| Northern Europeans | 98.9 /100 | #89 | Exceptional $47,698 |
| Italians | 98.8 /100 | #90 | Exceptional $47,574 |
| Macedonians | 98.8 /100 | #91 | Exceptional $47,573 |
| Immigrants | Moldova | 98.7 /100 | #92 | Exceptional $47,489 |
| Immigrants | Zimbabwe | 98.5 /100 | #93 | Exceptional $47,394 |
| Albanians | 98.5 /100 | #94 | Exceptional $47,379 |
| Immigrants | Egypt | 98.5 /100 | #95 | Exceptional $47,361 |
| Alsatians | 98.3 /100 | #96 | Exceptional $47,284 |
Demographics Similar to Immigrants from Syria by Per Capita Income
In terms of per capita income, the demographic groups most similar to Immigrants from Syria are Immigrants from Oceania ($45,220, a difference of 0.0%), Assyrian/Chaldean/Syriac ($45,195, a difference of 0.050%), Basque ($45,086, a difference of 0.29%), Immigrants from Jordan ($45,066, a difference of 0.34%), and Slavic ($45,049, a difference of 0.38%).
| Demographics | Rating | Rank | Per Capita Income |
| Arabs | 90.4 /100 | #130 | Exceptional $45,662 |
| Immigrants | North Macedonia | 90.0 /100 | #131 | Exceptional $45,622 |
| Jordanians | 89.9 /100 | #132 | Excellent $45,605 |
| Pakistanis | 89.7 /100 | #133 | Excellent $45,587 |
| Slovenes | 89.6 /100 | #134 | Excellent $45,581 |
| Hungarians | 87.9 /100 | #135 | Excellent $45,426 |
| Immigrants | Oceania | 85.2 /100 | #136 | Excellent $45,220 |
| Immigrants | Syria | 85.2 /100 | #137 | Excellent $45,218 |
| Assyrians/Chaldeans/Syriacs | 84.8 /100 | #138 | Excellent $45,195 |
| Basques | 83.2 /100 | #139 | Excellent $45,086 |
| Immigrants | Jordan | 82.9 /100 | #140 | Excellent $45,066 |
| Slavs | 82.6 /100 | #141 | Excellent $45,049 |
| Ugandans | 82.6 /100 | #142 | Excellent $45,047 |
| Immigrants | Uganda | 82.5 /100 | #143 | Excellent $45,043 |
| Icelanders | 81.6 /100 | #144 | Excellent $44,987 |