Nigerian vs Immigrants from Morocco Per Capita Income
COMPARE
Nigerian
Immigrants from Morocco
Per Capita Income
Per Capita Income Comparison
Nigerians
Immigrants from Morocco
$41,026
PER CAPITA INCOME
4.9/ 100
METRIC RATING
229th/ 347
METRIC RANK
$46,430
PER CAPITA INCOME
95.7/ 100
METRIC RATING
112th/ 347
METRIC RANK
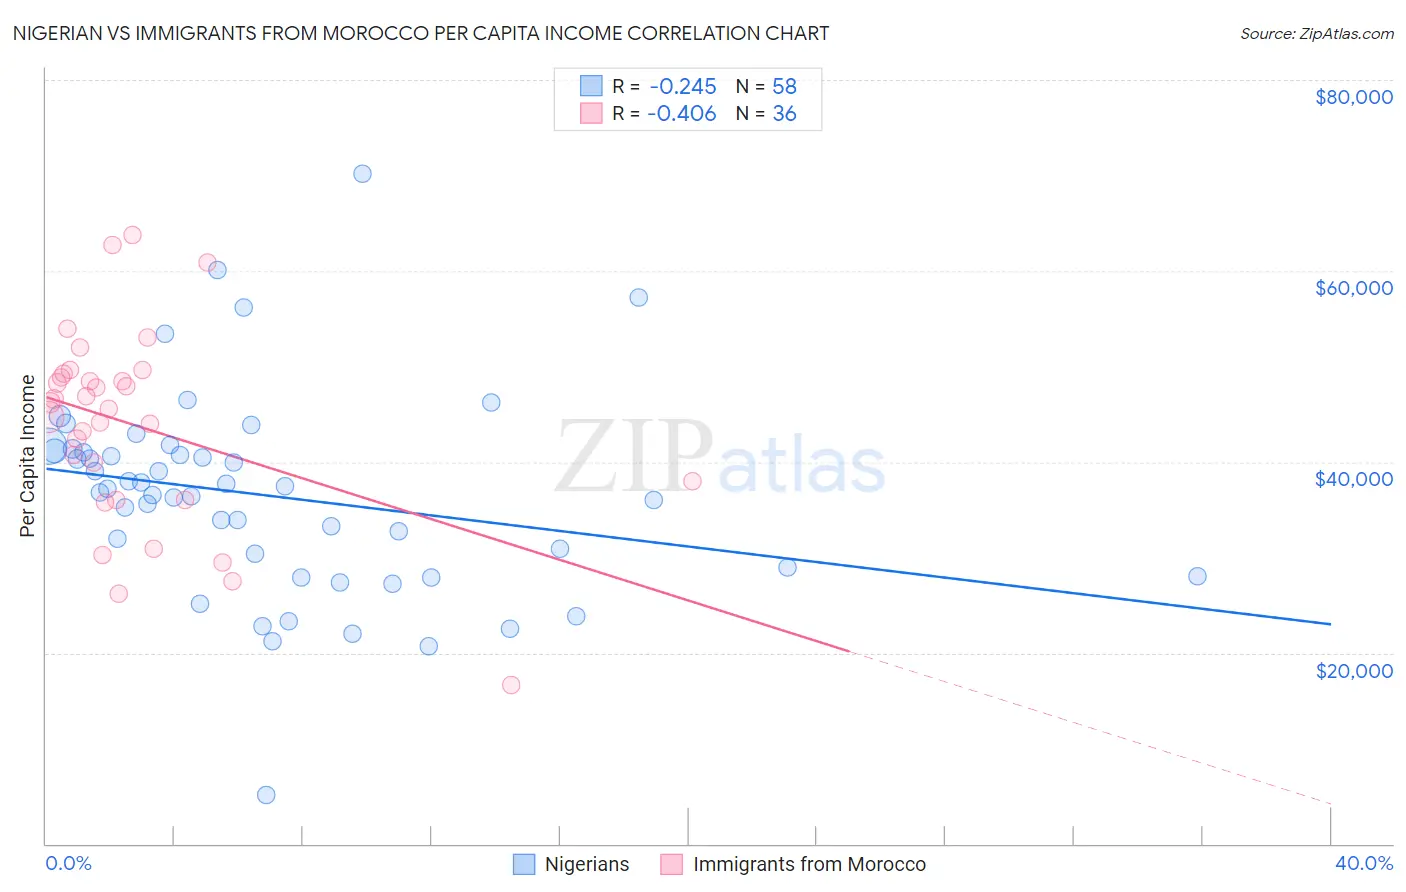
Nigerian vs Immigrants from Morocco Per Capita Income Correlation Chart
The statistical analysis conducted on geographies consisting of 332,796,588 people shows a weak negative correlation between the proportion of Nigerians and per capita income in the United States with a correlation coefficient (R) of -0.245 and weighted average of $41,026. Similarly, the statistical analysis conducted on geographies consisting of 178,911,890 people shows a moderate negative correlation between the proportion of Immigrants from Morocco and per capita income in the United States with a correlation coefficient (R) of -0.406 and weighted average of $46,430, a difference of 13.2%.
Per Capita Income Correlation Summary
| Measurement | Nigerian | Immigrants from Morocco |
| Minimum | $5,085 | $16,654 |
| Maximum | $70,186 | $63,792 |
| Range | $65,101 | $47,138 |
| Mean | $36,468 | $43,757 |
| Median | $37,024 | $45,863 |
| Interquartile 25% (IQ1) | $28,928 | $36,958 |
| Interquartile 75% (IQ3) | $41,176 | $49,075 |
| Interquartile Range (IQR) | $12,248 | $12,117 |
| Standard Deviation (Sample) | $10,721 | $10,240 |
| Standard Deviation (Population) | $10,628 | $10,097 |
Similar Demographics by Per Capita Income
Demographics Similar to Nigerians by Per Capita Income
In terms of per capita income, the demographic groups most similar to Nigerians are Native Hawaiian ($41,017, a difference of 0.020%), Senegalese ($41,000, a difference of 0.060%), Guyanese ($40,949, a difference of 0.19%), Immigrants from Grenada ($41,123, a difference of 0.24%), and Immigrants from Ghana ($41,131, a difference of 0.26%).
| Demographics | Rating | Rank | Per Capita Income |
| Immigrants | Iraq | 7.1 /100 | #222 | Tragic $41,365 |
| Immigrants | Cameroon | 6.8 /100 | #223 | Tragic $41,334 |
| Immigrants | St. Vincent and the Grenadines | 6.4 /100 | #224 | Tragic $41,270 |
| West Indians | 6.0 /100 | #225 | Tragic $41,217 |
| Immigrants | Ecuador | 5.9 /100 | #226 | Tragic $41,195 |
| Immigrants | Ghana | 5.5 /100 | #227 | Tragic $41,131 |
| Immigrants | Grenada | 5.5 /100 | #228 | Tragic $41,123 |
| Nigerians | 4.9 /100 | #229 | Tragic $41,026 |
| Native Hawaiians | 4.9 /100 | #230 | Tragic $41,017 |
| Senegalese | 4.8 /100 | #231 | Tragic $41,000 |
| Guyanese | 4.5 /100 | #232 | Tragic $40,949 |
| Delaware | 3.8 /100 | #233 | Tragic $40,778 |
| Immigrants | West Indies | 3.7 /100 | #234 | Tragic $40,763 |
| Immigrants | Guyana | 3.6 /100 | #235 | Tragic $40,742 |
| Immigrants | Nonimmigrants | 3.4 /100 | #236 | Tragic $40,669 |
Demographics Similar to Immigrants from Morocco by Per Capita Income
In terms of per capita income, the demographic groups most similar to Immigrants from Morocco are Taiwanese ($46,455, a difference of 0.050%), Chilean ($46,459, a difference of 0.060%), Immigrants from Albania ($46,387, a difference of 0.090%), Immigrants from Northern Africa ($46,531, a difference of 0.22%), and Immigrants from Kuwait ($46,543, a difference of 0.24%).
| Demographics | Rating | Rank | Per Capita Income |
| British | 96.3 /100 | #105 | Exceptional $46,571 |
| Ethiopians | 96.3 /100 | #106 | Exceptional $46,569 |
| Serbians | 96.2 /100 | #107 | Exceptional $46,551 |
| Immigrants | Kuwait | 96.2 /100 | #108 | Exceptional $46,543 |
| Immigrants | Northern Africa | 96.2 /100 | #109 | Exceptional $46,531 |
| Chileans | 95.9 /100 | #110 | Exceptional $46,459 |
| Taiwanese | 95.8 /100 | #111 | Exceptional $46,455 |
| Immigrants | Morocco | 95.7 /100 | #112 | Exceptional $46,430 |
| Immigrants | Albania | 95.5 /100 | #113 | Exceptional $46,387 |
| Afghans | 94.9 /100 | #114 | Exceptional $46,268 |
| Immigrants | Chile | 94.6 /100 | #115 | Exceptional $46,213 |
| Poles | 94.1 /100 | #116 | Exceptional $46,123 |
| Chinese | 93.9 /100 | #117 | Exceptional $46,098 |
| Immigrants | Saudi Arabia | 93.3 /100 | #118 | Exceptional $46,008 |
| Immigrants | Poland | 93.1 /100 | #119 | Exceptional $45,979 |