Nicaraguan vs Bolivian Per Capita Income
COMPARE
Nicaraguan
Bolivian
Per Capita Income
Per Capita Income Comparison
Nicaraguans
Bolivians
$39,372
PER CAPITA INCOME
0.8/ 100
METRIC RATING
257th/ 347
METRIC RANK
$49,526
PER CAPITA INCOME
99.9/ 100
METRIC RATING
65th/ 347
METRIC RANK
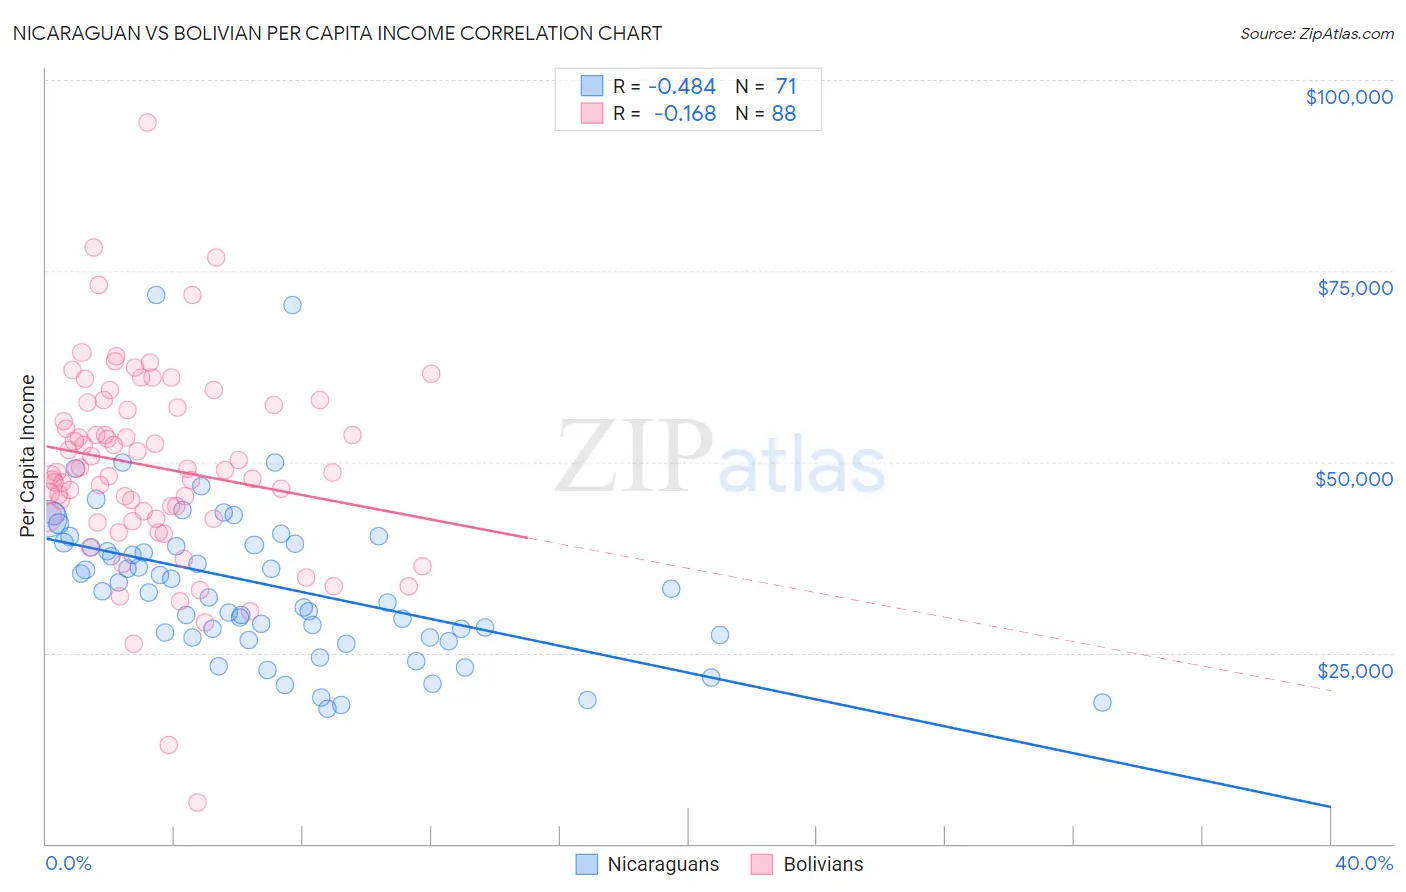
Nicaraguan vs Bolivian Per Capita Income Correlation Chart
The statistical analysis conducted on geographies consisting of 285,722,062 people shows a moderate negative correlation between the proportion of Nicaraguans and per capita income in the United States with a correlation coefficient (R) of -0.484 and weighted average of $39,372. Similarly, the statistical analysis conducted on geographies consisting of 184,684,256 people shows a poor negative correlation between the proportion of Bolivians and per capita income in the United States with a correlation coefficient (R) of -0.168 and weighted average of $49,526, a difference of 25.8%.
Per Capita Income Correlation Summary
| Measurement | Nicaraguan | Bolivian |
| Minimum | $17,623 | $5,324 |
| Maximum | $71,864 | $94,448 |
| Range | $54,241 | $89,124 |
| Mean | $33,908 | $49,375 |
| Median | $33,140 | $48,769 |
| Interquartile 25% (IQ1) | $27,013 | $42,691 |
| Interquartile 75% (IQ3) | $39,273 | $57,269 |
| Interquartile Range (IQR) | $12,260 | $14,578 |
| Standard Deviation (Sample) | $10,352 | $13,010 |
| Standard Deviation (Population) | $10,279 | $12,935 |
Similar Demographics by Per Capita Income
Demographics Similar to Nicaraguans by Per Capita Income
In terms of per capita income, the demographic groups most similar to Nicaraguans are Hawaiian ($39,403, a difference of 0.080%), Jamaican ($39,231, a difference of 0.36%), Immigrants from Middle Africa ($39,529, a difference of 0.40%), Malaysian ($39,194, a difference of 0.46%), and Alaska Native ($39,558, a difference of 0.47%).
| Demographics | Rating | Rank | Per Capita Income |
| Immigrants | Burma/Myanmar | 1.3 /100 | #250 | Tragic $39,827 |
| Samoans | 1.3 /100 | #251 | Tragic $39,826 |
| Immigrants | Azores | 1.0 /100 | #252 | Tragic $39,608 |
| Osage | 1.0 /100 | #253 | Tragic $39,568 |
| Alaska Natives | 1.0 /100 | #254 | Tragic $39,558 |
| Immigrants | Middle Africa | 1.0 /100 | #255 | Tragic $39,529 |
| Hawaiians | 0.8 /100 | #256 | Tragic $39,403 |
| Nicaraguans | 0.8 /100 | #257 | Tragic $39,372 |
| Jamaicans | 0.7 /100 | #258 | Tragic $39,231 |
| Malaysians | 0.7 /100 | #259 | Tragic $39,194 |
| Alaskan Athabascans | 0.6 /100 | #260 | Tragic $39,163 |
| Marshallese | 0.6 /100 | #261 | Tragic $39,108 |
| Iroquois | 0.6 /100 | #262 | Tragic $39,104 |
| Belizeans | 0.6 /100 | #263 | Tragic $39,097 |
| Americans | 0.6 /100 | #264 | Tragic $39,039 |
Demographics Similar to Bolivians by Per Capita Income
In terms of per capita income, the demographic groups most similar to Bolivians are Immigrants from Bulgaria ($49,482, a difference of 0.090%), Immigrants from Romania ($49,463, a difference of 0.13%), Lithuanian ($49,448, a difference of 0.16%), Immigrants from Argentina ($49,627, a difference of 0.20%), and Maltese ($49,640, a difference of 0.23%).
| Demographics | Rating | Rank | Per Capita Income |
| Immigrants | Malaysia | 99.9 /100 | #58 | Exceptional $49,983 |
| Bhutanese | 99.9 /100 | #59 | Exceptional $49,894 |
| Immigrants | Scotland | 99.9 /100 | #60 | Exceptional $49,893 |
| Argentineans | 99.9 /100 | #61 | Exceptional $49,862 |
| Immigrants | Asia | 99.9 /100 | #62 | Exceptional $49,741 |
| Maltese | 99.9 /100 | #63 | Exceptional $49,640 |
| Immigrants | Argentina | 99.9 /100 | #64 | Exceptional $49,627 |
| Bolivians | 99.9 /100 | #65 | Exceptional $49,526 |
| Immigrants | Bulgaria | 99.9 /100 | #66 | Exceptional $49,482 |
| Immigrants | Romania | 99.9 /100 | #67 | Exceptional $49,463 |
| Lithuanians | 99.8 /100 | #68 | Exceptional $49,448 |
| Immigrants | Canada | 99.8 /100 | #69 | Exceptional $49,412 |
| Immigrants | Eastern Europe | 99.8 /100 | #70 | Exceptional $49,316 |
| Greeks | 99.8 /100 | #71 | Exceptional $49,309 |
| Immigrants | Hungary | 99.8 /100 | #72 | Exceptional $49,303 |