Nicaraguan vs Belizean Median Household Income
COMPARE
Nicaraguan
Belizean
Median Household Income
Median Household Income Comparison
Nicaraguans
Belizeans
$79,737
MEDIAN HOUSEHOLD INCOME
3.1/ 100
METRIC RATING
237th/ 347
METRIC RANK
$77,028
MEDIAN HOUSEHOLD INCOME
0.6/ 100
METRIC RATING
256th/ 347
METRIC RANK
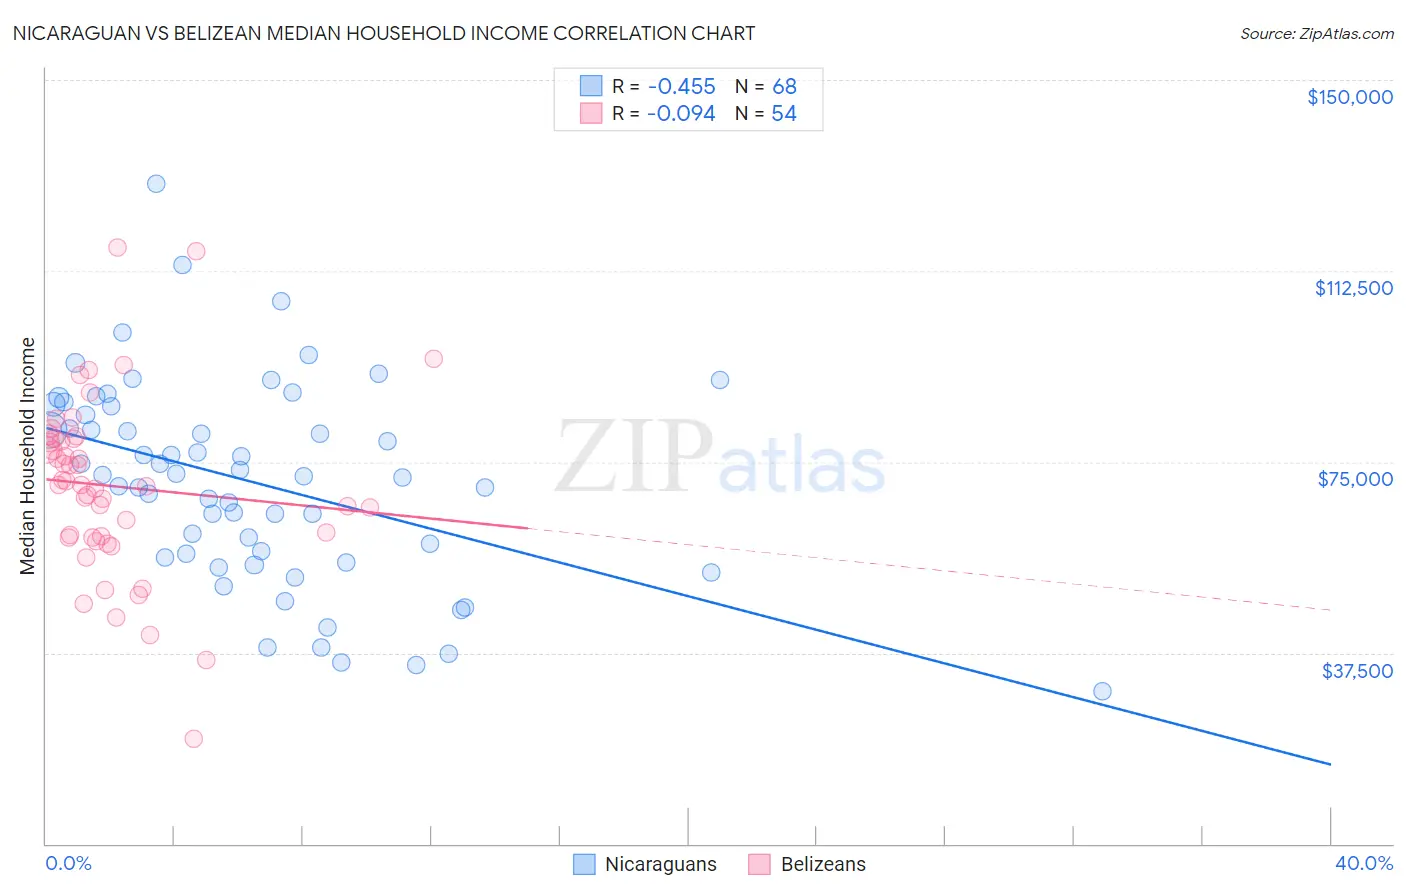
Nicaraguan vs Belizean Median Household Income Correlation Chart
The statistical analysis conducted on geographies consisting of 285,567,751 people shows a moderate negative correlation between the proportion of Nicaraguans and median household income in the United States with a correlation coefficient (R) of -0.455 and weighted average of $79,737. Similarly, the statistical analysis conducted on geographies consisting of 144,146,880 people shows a slight negative correlation between the proportion of Belizeans and median household income in the United States with a correlation coefficient (R) of -0.094 and weighted average of $77,028, a difference of 3.5%.
Median Household Income Correlation Summary
| Measurement | Nicaraguan | Belizean |
| Minimum | $29,878 | $20,723 |
| Maximum | $129,595 | $117,113 |
| Range | $99,717 | $96,390 |
| Mean | $70,971 | $70,224 |
| Median | $72,218 | $70,434 |
| Interquartile 25% (IQ1) | $56,639 | $60,138 |
| Interquartile 75% (IQ3) | $85,047 | $79,527 |
| Interquartile Range (IQR) | $28,408 | $19,389 |
| Standard Deviation (Sample) | $19,770 | $17,495 |
| Standard Deviation (Population) | $19,624 | $17,332 |
Demographics Similar to Nicaraguans and Belizeans by Median Household Income
In terms of median household income, the demographic groups most similar to Nicaraguans are Barbadian ($79,664, a difference of 0.090%), Immigrants from Bosnia and Herzegovina ($79,888, a difference of 0.19%), Alaska Native ($79,509, a difference of 0.29%), Immigrants from Western Africa ($79,490, a difference of 0.31%), and Nonimmigrants ($79,429, a difference of 0.39%). Similarly, the demographic groups most similar to Belizeans are Immigrants from Middle Africa ($77,559, a difference of 0.69%), Subsaharan African ($77,631, a difference of 0.78%), Immigrants from St. Vincent and the Grenadines ($77,690, a difference of 0.86%), Immigrants from West Indies ($77,956, a difference of 1.2%), and Mexican American Indian ($78,166, a difference of 1.5%).
| Demographics | Rating | Rank | Median Household Income |
| Immigrants | Bosnia and Herzegovina | 3.4 /100 | #236 | Tragic $79,888 |
| Nicaraguans | 3.1 /100 | #237 | Tragic $79,737 |
| Barbadians | 3.0 /100 | #238 | Tragic $79,664 |
| Alaska Natives | 2.7 /100 | #239 | Tragic $79,509 |
| Immigrants | Western Africa | 2.7 /100 | #240 | Tragic $79,490 |
| Immigrants | Nonimmigrants | 2.6 /100 | #241 | Tragic $79,429 |
| Immigrants | Sudan | 2.1 /100 | #242 | Tragic $79,103 |
| Immigrants | Barbados | 1.9 /100 | #243 | Tragic $78,989 |
| Marshallese | 1.9 /100 | #244 | Tragic $78,930 |
| Inupiat | 1.8 /100 | #245 | Tragic $78,841 |
| Central Americans | 1.7 /100 | #246 | Tragic $78,803 |
| Immigrants | Burma/Myanmar | 1.6 /100 | #247 | Tragic $78,682 |
| Sudanese | 1.5 /100 | #248 | Tragic $78,529 |
| West Indians | 1.4 /100 | #249 | Tragic $78,455 |
| Immigrants | Laos | 1.3 /100 | #250 | Tragic $78,327 |
| Mexican American Indians | 1.2 /100 | #251 | Tragic $78,166 |
| Immigrants | West Indies | 1.0 /100 | #252 | Tragic $77,956 |
| Immigrants | St. Vincent and the Grenadines | 0.9 /100 | #253 | Tragic $77,690 |
| Sub-Saharan Africans | 0.8 /100 | #254 | Tragic $77,631 |
| Immigrants | Middle Africa | 0.8 /100 | #255 | Tragic $77,559 |
| Belizeans | 0.6 /100 | #256 | Tragic $77,028 |