Navajo vs Immigrants from Cuba Householder Income Ages 25 - 44 years
COMPARE
Navajo
Immigrants from Cuba
Householder Income Ages 25 - 44 years
Householder Income Ages 25 - 44 years Comparison
Navajo
Immigrants from Cuba
$66,529
HOUSEHOLDER INCOME AGES 25 - 44 YEARS
0.0/ 100
METRIC RATING
345th/ 347
METRIC RANK
$76,701
HOUSEHOLDER INCOME AGES 25 - 44 YEARS
0.0/ 100
METRIC RATING
328th/ 347
METRIC RANK
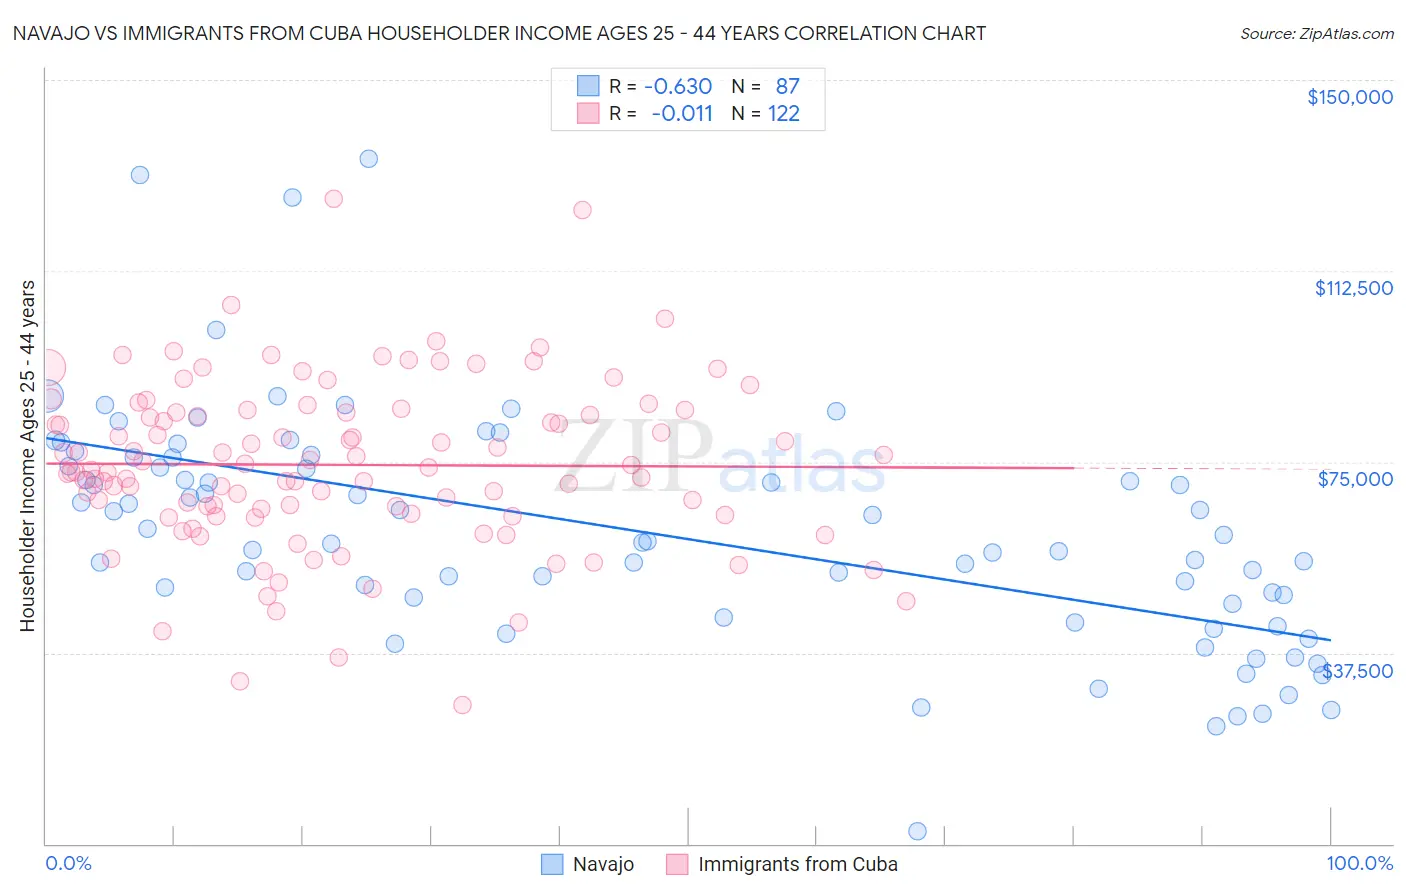
Navajo vs Immigrants from Cuba Householder Income Ages 25 - 44 years Correlation Chart
The statistical analysis conducted on geographies consisting of 224,307,883 people shows a significant negative correlation between the proportion of Navajo and household income with householder between the ages 25 and 44 in the United States with a correlation coefficient (R) of -0.630 and weighted average of $66,529. Similarly, the statistical analysis conducted on geographies consisting of 325,310,013 people shows no correlation between the proportion of Immigrants from Cuba and household income with householder between the ages 25 and 44 in the United States with a correlation coefficient (R) of -0.011 and weighted average of $76,701, a difference of 15.3%.
Householder Income Ages 25 - 44 years Correlation Summary
| Measurement | Navajo | Immigrants from Cuba |
| Minimum | $2,499 | $27,269 |
| Maximum | $134,464 | $126,663 |
| Range | $131,965 | $99,394 |
| Mean | $61,342 | $74,412 |
| Median | $59,389 | $73,548 |
| Interquartile 25% (IQ1) | $47,194 | $64,878 |
| Interquartile 75% (IQ3) | $75,867 | $84,816 |
| Interquartile Range (IQR) | $28,673 | $19,938 |
| Standard Deviation (Sample) | $22,974 | $16,521 |
| Standard Deviation (Population) | $22,841 | $16,454 |
Demographics Similar to Navajo and Immigrants from Cuba by Householder Income Ages 25 - 44 years
In terms of householder income ages 25 - 44 years, the demographic groups most similar to Navajo are Puerto Rican ($65,996, a difference of 0.81%), Pueblo ($68,910, a difference of 3.6%), Tohono O'odham ($69,068, a difference of 3.8%), Crow ($71,337, a difference of 7.2%), and Arapaho ($71,697, a difference of 7.8%). Similarly, the demographic groups most similar to Immigrants from Cuba are Seminole ($76,584, a difference of 0.15%), Immigrants from Bahamas ($76,910, a difference of 0.27%), Houma ($77,044, a difference of 0.45%), Yakama ($76,226, a difference of 0.62%), and Native/Alaskan ($75,647, a difference of 1.4%).
| Demographics | Rating | Rank | Householder Income Ages 25 - 44 years |
| Houma | 0.0 /100 | #326 | Tragic $77,044 |
| Immigrants | Bahamas | 0.0 /100 | #327 | Tragic $76,910 |
| Immigrants | Cuba | 0.0 /100 | #328 | Tragic $76,701 |
| Seminole | 0.0 /100 | #329 | Tragic $76,584 |
| Yakama | 0.0 /100 | #330 | Tragic $76,226 |
| Natives/Alaskans | 0.0 /100 | #331 | Tragic $75,647 |
| Bahamians | 0.0 /100 | #332 | Tragic $75,395 |
| Hopi | 0.0 /100 | #333 | Tragic $75,002 |
| Creek | 0.0 /100 | #334 | Tragic $74,847 |
| Kiowa | 0.0 /100 | #335 | Tragic $74,776 |
| Yup'ik | 0.0 /100 | #336 | Tragic $73,688 |
| Blacks/African Americans | 0.0 /100 | #337 | Tragic $73,370 |
| Immigrants | Yemen | 0.0 /100 | #338 | Tragic $73,043 |
| Yuman | 0.0 /100 | #339 | Tragic $72,956 |
| Immigrants | Congo | 0.0 /100 | #340 | Tragic $72,178 |
| Arapaho | 0.0 /100 | #341 | Tragic $71,697 |
| Crow | 0.0 /100 | #342 | Tragic $71,337 |
| Tohono O'odham | 0.0 /100 | #343 | Tragic $69,068 |
| Pueblo | 0.0 /100 | #344 | Tragic $68,910 |
| Navajo | 0.0 /100 | #345 | Tragic $66,529 |
| Puerto Ricans | 0.0 /100 | #346 | Tragic $65,996 |