Native/Alaskan vs Pakistani Householder Income Ages 25 - 44 years

COMPARE

Native/Alaskan
Race
Ancestry
AfghanAfricanAlaska NativeAlaskan AthabascanAlbanianAleutAlsatianAmericanApacheArabArapahoArgentineanArmenianAssyrian/Chaldean/SyriacAustralianAustrianBahamianBangladeshiBarbadianBasqueBelgianBelizeanBermudanBhutaneseBlackfeetBolivianBrazilianBritishBritish West IndianBulgarianBurmeseCajunCambodianCanadianCape VerdeanCarpatho RusynCelticCentral AmericanCentral American IndianCherokeeCheyenneChickasawChileanChineseChippewaChoctawColombianColvilleComancheCosta RicanCreeCreekCroatianCrowCubanCypriotCzechCzechoslovakianDanishDelawareDominicanDutchDutch West IndianEastern EuropeanEcuadorianEgyptianEnglishEstonianEthiopianEuropeanFijianFilipinoFinnishFrenchFrench American IndianFrench CanadianGermanGerman RussianGhanaianGreekGuamanian/ChamorroGuatemalanGuyaneseHaitianHmongHonduranHopiHoumaHungarianIcelanderIndian (Asian)IndonesianInupiatIranianIraqiIrishIroquoisIsraeliItalianJamaicanJapaneseJordanianKenyanKiowaKoreanLaotianLatvianLebaneseLiberianLithuanianLumbeeLuxembourgerMacedonianMalaysianMalteseMarshalleseMenomineeMexicanMexican American IndianMongolianMoroccanNative HawaiianNavajoNepaleseNew ZealanderNicaraguanNigerianNorthern EuropeanNorwegianOkinawanOsageOttawaPaiutePalestinianPanamanianParaguayanPennsylvania GermanPeruvianPimaPolishPortuguesePotawatomiPuebloPuerto RicanPuget Sound SalishRomanianRussianSalvadoranSamoanScandinavianScotch-IrishScottishSeminoleSenegaleseSerbianShoshoneSierra LeoneanSiouxSlavicSlovakSloveneSomaliSouth AfricanSouth AmericanSouth American IndianSoviet UnionSpaniardSpanishSpanish AmericanSpanish American IndianSri LankanSubsaharan AfricanSudaneseSwedishSwissSyrianTaiwaneseThaiTlingit-HaidaTohono O'OdhamTonganTrinidadian and TobagonianTsimshianTurkishU.S. Virgin IslanderUgandanUkrainianUruguayanUteVenezuelanVietnameseWelshWest IndianYakamaYaquiYugoslavianYumanYup'ikZimbabwean
Immigration
NonimmigrantsImmigrantsAfghanistanAfricaAlbaniaArgentinaArmeniaAsiaAustraliaAustriaBahamasBangladeshBarbadosBelarusBelgiumBelizeBoliviaBosnia and HerzegovinaBrazilBulgariaBurma/MyanmarCabo VerdeCambodiaCameroonCanadaCaribbeanCentral AmericaChileChinaColombiaCongoCosta RicaCroatiaCubaCzechoslovakiaDenmarkDominicaDominican RepublicEastern AfricaEastern AsiaEastern EuropeEcuadorEgyptEl SalvadorEnglandEritreaEthiopiaEuropeFijiFranceGermanyGhanaGreeceGrenadaGuatemalaGuyanaHaitiHondurasHong KongHungaryIndiaIndonesiaIranIraqIrelandIsraelItalyJamaicaJapanJordanKazakhstanKenyaKoreaKuwaitLaosLatin AmericaLatviaLebanonLiberiaLithuaniaMalaysiaMexicoMicronesiaMiddle AfricaMoldovaMoroccoNepalNetherlandsNicaraguaNigeriaNorth AmericaNorth MacedoniaNorthern AfricaNorthern EuropeNorwayOceaniaPakistanPanamaPeruPhilippinesPolandPortugalRomaniaRussiaSaudi ArabiaScotlandSenegalSerbiaSierra LeoneSingaporeSomaliaSouth AfricaSouth AmericaSouth Central AsiaSouth Eastern AsiaSouthern EuropeSpainSri LankaSt. Vincent and the GrenadinesSudanSwedenSwitzerlandSyriaTaiwanThailandTrinidad and TobagoTurkeyUgandaUkraineUruguayUzbekistanVenezuelaVietnamWest IndiesWestern AfricaWestern AsiaWestern EuropeYemenZaireZimbabweAzores
Pakistani
Race
Ancestry
AfghanAfricanAlaska NativeAlaskan AthabascanAlbanianAleutAlsatianAmericanApacheArabArapahoArgentineanArmenianAssyrian/Chaldean/SyriacAustralianAustrianBahamianBangladeshiBarbadianBasqueBelgianBelizeanBermudanBhutaneseBlackfeetBolivianBrazilianBritishBritish West IndianBulgarianBurmeseCajunCambodianCanadianCape VerdeanCarpatho RusynCelticCentral AmericanCentral American IndianCherokeeCheyenneChickasawChileanChineseChippewaChoctawColombianColvilleComancheCosta RicanCreeCreekCroatianCrowCubanCypriotCzechCzechoslovakianDanishDelawareDominicanDutchDutch West IndianEastern EuropeanEcuadorianEgyptianEnglishEstonianEthiopianEuropeanFijianFilipinoFinnishFrenchFrench American IndianFrench CanadianGermanGerman RussianGhanaianGreekGuamanian/ChamorroGuatemalanGuyaneseHaitianHmongHonduranHopiHoumaHungarianIcelanderIndian (Asian)IndonesianInupiatIranianIraqiIrishIroquoisIsraeliItalianJamaicanJapaneseJordanianKenyanKiowaKoreanLaotianLatvianLebaneseLiberianLithuanianLumbeeLuxembourgerMacedonianMalaysianMalteseMarshalleseMenomineeMexicanMexican American IndianMongolianMoroccanNative HawaiianNavajoNepaleseNew ZealanderNicaraguanNigerianNorthern EuropeanNorwegianOkinawanOsageOttawaPaiutePakistaniPalestinianPanamanianParaguayanPennsylvania GermanPeruvianPimaPolishPortuguesePotawatomiPuebloPuerto RicanPuget Sound SalishRomanianRussianSalvadoranSamoanScandinavianScotch-IrishScottishSeminoleSenegaleseSerbianShoshoneSierra LeoneanSiouxSlavicSlovakSloveneSomaliSouth AfricanSouth AmericanSouth American IndianSoviet UnionSpaniardSpanishSpanish AmericanSpanish American IndianSri LankanSubsaharan AfricanSudaneseSwedishSwissSyrianTaiwaneseThaiTlingit-HaidaTohono O'OdhamTonganTrinidadian and TobagonianTsimshianTurkishU.S. Virgin IslanderUgandanUkrainianUruguayanUteVenezuelanVietnameseWelshWest IndianYakamaYaquiYugoslavianYumanYup'ikZimbabwean
Immigration
NonimmigrantsImmigrantsAfghanistanAfricaAlbaniaArgentinaArmeniaAsiaAustraliaAustriaBahamasBangladeshBarbadosBelarusBelgiumBelizeBoliviaBosnia and HerzegovinaBrazilBulgariaBurma/MyanmarCabo VerdeCambodiaCameroonCanadaCaribbeanCentral AmericaChileChinaColombiaCongoCosta RicaCroatiaCubaCzechoslovakiaDenmarkDominicaDominican RepublicEastern AfricaEastern AsiaEastern EuropeEcuadorEgyptEl SalvadorEnglandEritreaEthiopiaEuropeFijiFranceGermanyGhanaGreeceGrenadaGuatemalaGuyanaHaitiHondurasHong KongHungaryIndiaIndonesiaIranIraqIrelandIsraelItalyJamaicaJapanJordanKazakhstanKenyaKoreaKuwaitLaosLatin AmericaLatviaLebanonLiberiaLithuaniaMalaysiaMexicoMicronesiaMiddle AfricaMoldovaMoroccoNepalNetherlandsNicaraguaNigeriaNorth AmericaNorth MacedoniaNorthern AfricaNorthern EuropeNorwayOceaniaPakistanPanamaPeruPhilippinesPolandPortugalRomaniaRussiaSaudi ArabiaScotlandSenegalSerbiaSierra LeoneSingaporeSomaliaSouth AfricaSouth AmericaSouth Central AsiaSouth Eastern AsiaSouthern EuropeSpainSri LankaSt. Vincent and the GrenadinesSudanSwedenSwitzerlandSyriaTaiwanThailandTrinidad and TobagoTurkeyUgandaUkraineUruguayUzbekistanVenezuelaVietnamWest IndiesWestern AfricaWestern AsiaWestern EuropeYemenZaireZimbabweAzores
Householder Income Ages 25 - 44 years
Income
Poverty
Unemployment
Labor Participation
Family Structure
Vehicle Availability
Education Level
Disability

Householder Income Ages 25 - 44 years Comparison

Natives/Alaskans

Pakistanis

Tragic
Excellent
$75,647
HOUSEHOLDER INCOME AGES 25 - 44 YEARS
0.0/ 100
METRIC RATING
331st/ 347
METRIC RANK
$98,401
HOUSEHOLDER INCOME AGES 25 - 44 YEARS
89.3/ 100
METRIC RATING
125th/ 347
METRIC RANK

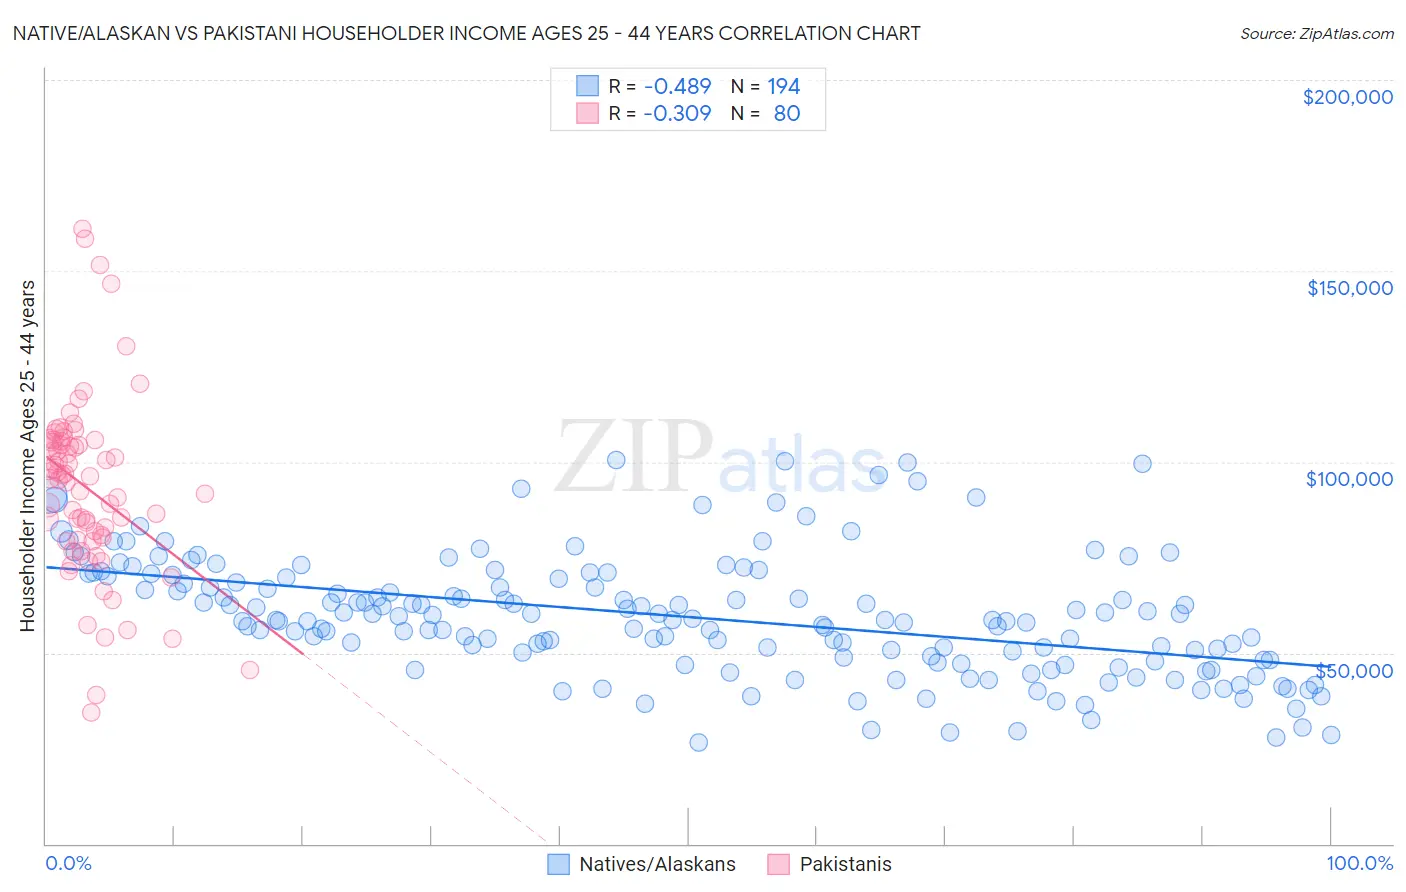
Native/Alaskan vs Pakistani Householder Income Ages 25 - 44 years Correlation Chart

The statistical analysis conducted on geographies consisting of 509,973,002 people shows a moderate negative correlation between the proportion of Natives/Alaskans and household income with householder between the ages 25 and 44 in the United States with a correlation coefficient (R) of -0.489 and weighted average of $75,647. Similarly, the statistical analysis conducted on geographies consisting of 334,652,075 people shows a mild negative correlation between the proportion of Pakistanis and household income with householder between the ages 25 and 44 in the United States with a correlation coefficient (R) of -0.309 and weighted average of $98,401, a difference of 30.1%.
Native/Alaskan vs Pakistani Householder Income Ages 25 - 44 years

Householder Income Ages 25 - 44 years Correlation Summary

MeasurementNative/AlaskanPakistani
Minimum$26,585$34,363
Maximum$100,355$161,157
Range$73,770$126,794
Mean$59,417$93,256
Median$58,652$95,924
Interquartile 25% (IQ1)$48,151$79,748
Interquartile 75% (IQ3)$69,627$105,308
Interquartile Range (IQR)$21,476$25,561
Standard Deviation (Sample)$15,647$23,370
Standard Deviation (Population)$15,607$23,224

Similar Demographics by Householder Income Ages 25 - 44 years

Demographics Similar to Natives/Alaskans by Householder Income Ages 25 - 44 years

In terms of householder income ages 25 - 44 years, the demographic groups most similar to Natives/Alaskans are Bahamian ($75,395, a difference of 0.34%), Yakama ($76,226, a difference of 0.76%), Hopi ($75,002, a difference of 0.86%), Creek ($74,847, a difference of 1.1%), and Kiowa ($74,776, a difference of 1.2%).
DemographicsRating | RankHouseholder Income Ages 25 - 44 years
Dutch West Indians
0.0
/100
|
#324
Tragic
$77,260
Sioux
0.0
/100
|
#325
Tragic
$77,089
Houma
0.0
/100
|
#326
Tragic
$77,044
Immigrants | Bahamas
0.0
/100
|
#327
Tragic
$76,910
Immigrants | Cuba
0.0
/100
|
#328
Tragic
$76,701
Seminole
0.0
/100
|
#329
Tragic
$76,584
Yakama
0.0
/100
|
#330
Tragic
$76,226
Natives/Alaskans
0.0
/100
|
#331
Tragic
$75,647
Bahamians
0.0
/100
|
#332
Tragic
$75,395
Hopi
0.0
/100
|
#333
Tragic
$75,002
Creek
0.0
/100
|
#334
Tragic
$74,847
Kiowa
0.0
/100
|
#335
Tragic
$74,776
Yup'ik
0.0
/100
|
#336
Tragic
$73,688
Blacks/African Americans
0.0
/100
|
#337
Tragic
$73,370
Immigrants | Yemen
0.0
/100
|
#338
Tragic
$73,043

Demographics Similar to Pakistanis by Householder Income Ages 25 - 44 years

In terms of householder income ages 25 - 44 years, the demographic groups most similar to Pakistanis are British ($98,359, a difference of 0.040%), Serbian ($98,320, a difference of 0.080%), European ($98,310, a difference of 0.090%), Brazilian ($98,267, a difference of 0.14%), and Zimbabwean ($98,586, a difference of 0.19%).
DemographicsRating | RankHouseholder Income Ages 25 - 44 years
Syrians
92.9
/100
|
#118
Exceptional
$99,215
Jordanians
92.8
/100
|
#119
Exceptional
$99,186
Swedes
92.7
/100
|
#120
Exceptional
$99,136
Peruvians
91.7
/100
|
#121
Exceptional
$98,886
Immigrants | Uzbekistan
91.5
/100
|
#122
Exceptional
$98,849
Palestinians
91.2
/100
|
#123
Exceptional
$98,777
Zimbabweans
90.3
/100
|
#124
Exceptional
$98,586
Pakistanis
89.3
/100
|
#125
Excellent
$98,401
British
89.1
/100
|
#126
Excellent
$98,359
Serbians
88.9
/100
|
#127
Excellent
$98,320
Europeans
88.9
/100
|
#128
Excellent
$98,310
Brazilians
88.6
/100
|
#129
Excellent
$98,267
Immigrants | Kuwait
87.8
/100
|
#130
Excellent
$98,122
Immigrants | Albania
86.6
/100
|
#131
Excellent
$97,929
Immigrants | Zimbabwe
86.3
/100
|
#132
Excellent
$97,880