Native/Alaskan vs Immigrants from Morocco Median Earnings
COMPARE
Native/Alaskan
Immigrants from Morocco
Median Earnings
Median Earnings Comparison
Natives/Alaskans
Immigrants from Morocco
$38,896
MEDIAN EARNINGS
0.0/ 100
METRIC RATING
335th/ 347
METRIC RANK
$49,368
MEDIAN EARNINGS
98.4/ 100
METRIC RATING
107th/ 347
METRIC RANK
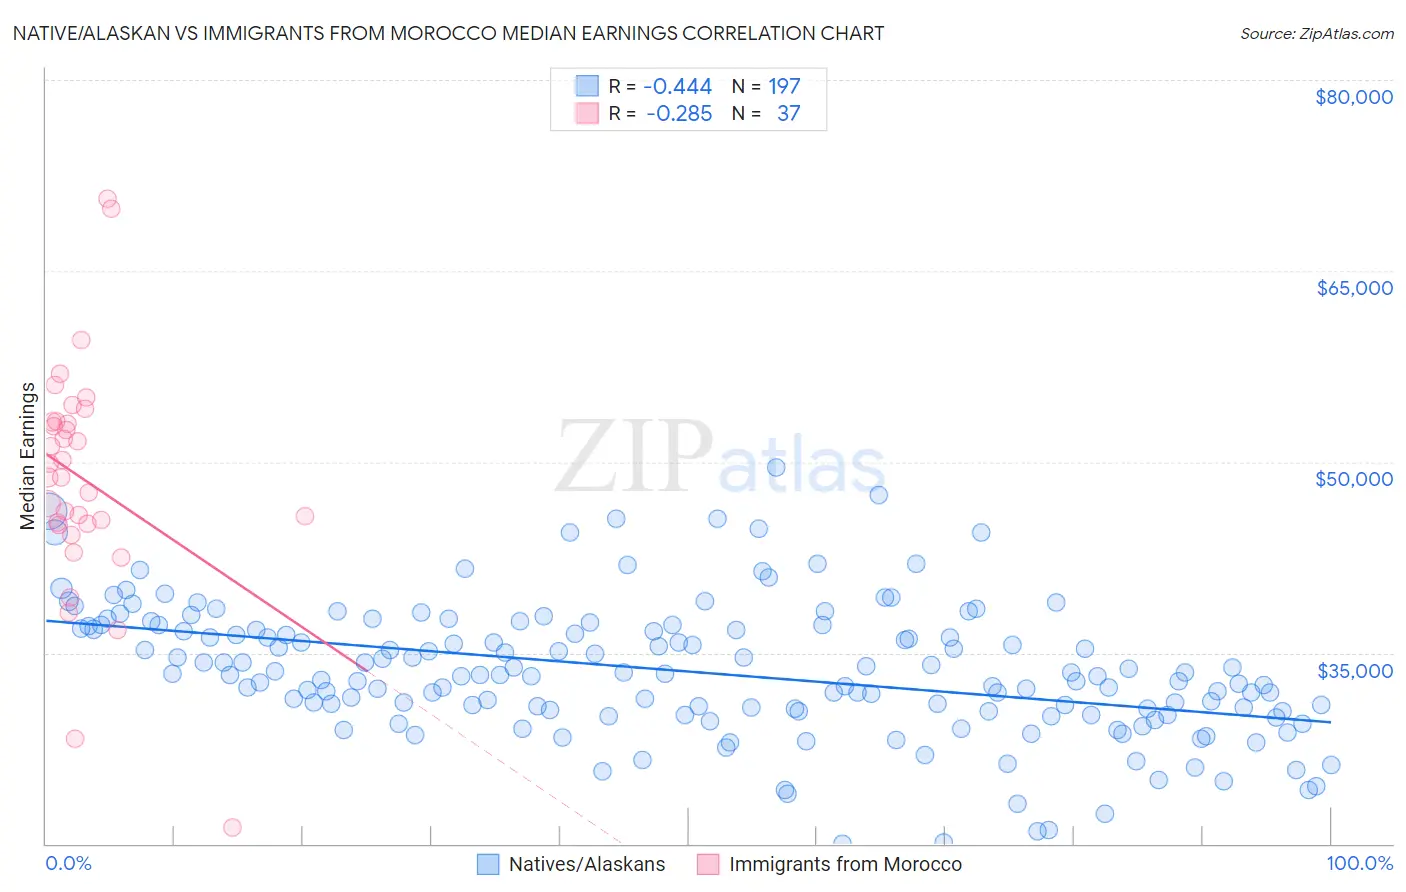
Native/Alaskan vs Immigrants from Morocco Median Earnings Correlation Chart
The statistical analysis conducted on geographies consisting of 512,831,083 people shows a moderate negative correlation between the proportion of Natives/Alaskans and median earnings in the United States with a correlation coefficient (R) of -0.444 and weighted average of $38,896. Similarly, the statistical analysis conducted on geographies consisting of 178,911,278 people shows a weak negative correlation between the proportion of Immigrants from Morocco and median earnings in the United States with a correlation coefficient (R) of -0.285 and weighted average of $49,368, a difference of 26.9%.
Median Earnings Correlation Summary
| Measurement | Native/Alaskan | Immigrants from Morocco |
| Minimum | $20,036 | $21,250 |
| Maximum | $49,581 | $70,625 |
| Range | $29,544 | $49,375 |
| Mean | $33,526 | $48,644 |
| Median | $33,302 | $48,771 |
| Interquartile 25% (IQ1) | $30,416 | $45,090 |
| Interquartile 75% (IQ3) | $36,881 | $53,191 |
| Interquartile Range (IQR) | $6,465 | $8,101 |
| Standard Deviation (Sample) | $5,244 | $9,241 |
| Standard Deviation (Population) | $5,231 | $9,116 |
Similar Demographics by Median Earnings
Demographics Similar to Natives/Alaskans by Median Earnings
In terms of median earnings, the demographic groups most similar to Natives/Alaskans are Spanish American Indian ($38,907, a difference of 0.030%), Houma ($38,949, a difference of 0.14%), Crow ($38,707, a difference of 0.49%), Yakama ($39,107, a difference of 0.54%), and Immigrants from Mexico ($39,114, a difference of 0.56%).
| Demographics | Rating | Rank | Median Earnings |
| Sioux | 0.0 /100 | #328 | Tragic $39,448 |
| Kiowa | 0.0 /100 | #329 | Tragic $39,232 |
| Immigrants | Congo | 0.0 /100 | #330 | Tragic $39,169 |
| Immigrants | Mexico | 0.0 /100 | #331 | Tragic $39,114 |
| Yakama | 0.0 /100 | #332 | Tragic $39,107 |
| Houma | 0.0 /100 | #333 | Tragic $38,949 |
| Spanish American Indians | 0.0 /100 | #334 | Tragic $38,907 |
| Natives/Alaskans | 0.0 /100 | #335 | Tragic $38,896 |
| Crow | 0.0 /100 | #336 | Tragic $38,707 |
| Immigrants | Cuba | 0.0 /100 | #337 | Tragic $38,426 |
| Pima | 0.0 /100 | #338 | Tragic $38,285 |
| Menominee | 0.0 /100 | #339 | Tragic $37,884 |
| Navajo | 0.0 /100 | #340 | Tragic $36,999 |
| Lumbee | 0.0 /100 | #341 | Tragic $36,876 |
| Hopi | 0.0 /100 | #342 | Tragic $36,871 |
Demographics Similar to Immigrants from Morocco by Median Earnings
In terms of median earnings, the demographic groups most similar to Immigrants from Morocco are Immigrants from Albania ($49,377, a difference of 0.020%), Immigrants from Western Asia ($49,389, a difference of 0.040%), Immigrants from Brazil ($49,463, a difference of 0.19%), Austrian ($49,501, a difference of 0.27%), and Palestinian ($49,209, a difference of 0.32%).
| Demographics | Rating | Rank | Median Earnings |
| Immigrants | Poland | 98.9 /100 | #100 | Exceptional $49,633 |
| Jordanians | 98.9 /100 | #101 | Exceptional $49,632 |
| Ethiopians | 98.8 /100 | #102 | Exceptional $49,572 |
| Austrians | 98.7 /100 | #103 | Exceptional $49,501 |
| Immigrants | Brazil | 98.6 /100 | #104 | Exceptional $49,463 |
| Immigrants | Western Asia | 98.4 /100 | #105 | Exceptional $49,389 |
| Immigrants | Albania | 98.4 /100 | #106 | Exceptional $49,377 |
| Immigrants | Morocco | 98.4 /100 | #107 | Exceptional $49,368 |
| Palestinians | 98.0 /100 | #108 | Exceptional $49,209 |
| Syrians | 97.1 /100 | #109 | Exceptional $48,934 |
| Immigrants | Ethiopia | 97.1 /100 | #110 | Exceptional $48,924 |
| Immigrants | Zimbabwe | 97.0 /100 | #111 | Exceptional $48,913 |
| Northern Europeans | 96.9 /100 | #112 | Exceptional $48,887 |
| Immigrants | Kuwait | 96.8 /100 | #113 | Exceptional $48,861 |
| Moroccans | 96.7 /100 | #114 | Exceptional $48,838 |