Native Hawaiian vs Immigrants from Yemen Householder Income Over 65 years

COMPARE

Native Hawaiian
Race
Ancestry
AfghanAfricanAlaska NativeAlaskan AthabascanAlbanianAleutAlsatianAmericanApacheArabArapahoArgentineanArmenianAssyrian/Chaldean/SyriacAustralianAustrianBahamianBangladeshiBarbadianBasqueBelgianBelizeanBermudanBhutaneseBlackfeetBolivianBrazilianBritishBritish West IndianBulgarianBurmeseCajunCambodianCanadianCape VerdeanCarpatho RusynCelticCentral AmericanCentral American IndianCherokeeCheyenneChickasawChileanChineseChippewaChoctawColombianColvilleComancheCosta RicanCreeCreekCroatianCrowCubanCypriotCzechCzechoslovakianDanishDelawareDominicanDutchDutch West IndianEastern EuropeanEcuadorianEgyptianEnglishEstonianEthiopianEuropeanFijianFilipinoFinnishFrenchFrench American IndianFrench CanadianGermanGerman RussianGhanaianGreekGuamanian/ChamorroGuatemalanGuyaneseHaitianHmongHonduranHopiHoumaHungarianIcelanderIndian (Asian)IndonesianInupiatIranianIraqiIrishIroquoisIsraeliItalianJamaicanJapaneseJordanianKenyanKiowaKoreanLaotianLatvianLebaneseLiberianLithuanianLumbeeLuxembourgerMacedonianMalaysianMalteseMarshalleseMenomineeMexicanMexican American IndianMongolianMoroccanNative HawaiianNavajoNepaleseNew ZealanderNicaraguanNigerianNorthern EuropeanNorwegianOkinawanOsageOttawaPaiutePakistaniPalestinianPanamanianParaguayanPennsylvania GermanPeruvianPimaPolishPortuguesePotawatomiPuebloPuerto RicanPuget Sound SalishRomanianRussianSalvadoranSamoanScandinavianScotch-IrishScottishSeminoleSenegaleseSerbianShoshoneSierra LeoneanSiouxSlavicSlovakSloveneSomaliSouth AfricanSouth AmericanSouth American IndianSoviet UnionSpaniardSpanishSpanish AmericanSpanish American IndianSri LankanSubsaharan AfricanSudaneseSwedishSwissSyrianTaiwaneseThaiTlingit-HaidaTohono O'OdhamTonganTrinidadian and TobagonianTsimshianTurkishU.S. Virgin IslanderUgandanUkrainianUruguayanUteVenezuelanVietnameseWelshWest IndianYakamaYaquiYugoslavianYumanYup'ikZimbabwean
Immigration
NonimmigrantsImmigrantsAfghanistanAfricaAlbaniaArgentinaArmeniaAsiaAustraliaAustriaBahamasBangladeshBarbadosBelarusBelgiumBelizeBoliviaBosnia and HerzegovinaBrazilBulgariaBurma/MyanmarCabo VerdeCambodiaCameroonCanadaCaribbeanCentral AmericaChileChinaColombiaCongoCosta RicaCroatiaCubaCzechoslovakiaDenmarkDominicaDominican RepublicEastern AfricaEastern AsiaEastern EuropeEcuadorEgyptEl SalvadorEnglandEritreaEthiopiaEuropeFijiFranceGermanyGhanaGreeceGrenadaGuatemalaGuyanaHaitiHondurasHong KongHungaryIndiaIndonesiaIranIraqIrelandIsraelItalyJamaicaJapanJordanKazakhstanKenyaKoreaKuwaitLaosLatin AmericaLatviaLebanonLiberiaLithuaniaMalaysiaMexicoMicronesiaMiddle AfricaMoldovaMoroccoNepalNetherlandsNicaraguaNigeriaNorth AmericaNorth MacedoniaNorthern AfricaNorthern EuropeNorwayOceaniaPakistanPanamaPeruPhilippinesPolandPortugalRomaniaRussiaSaudi ArabiaScotlandSenegalSerbiaSierra LeoneSingaporeSomaliaSouth AfricaSouth AmericaSouth Central AsiaSouth Eastern AsiaSouthern EuropeSpainSri LankaSt. Vincent and the GrenadinesSudanSwedenSwitzerlandSyriaTaiwanThailandTrinidad and TobagoTurkeyUgandaUkraineUruguayUzbekistanVenezuelaVietnamWest IndiesWestern AfricaWestern AsiaWestern EuropeZaireZimbabweAzores
Immigrants from Yemen
Race
Ancestry
AfghanAfricanAlaska NativeAlaskan AthabascanAlbanianAleutAlsatianAmericanApacheArabArapahoArgentineanArmenianAssyrian/Chaldean/SyriacAustralianAustrianBahamianBangladeshiBarbadianBasqueBelgianBelizeanBermudanBhutaneseBlackfeetBolivianBrazilianBritishBritish West IndianBulgarianBurmeseCajunCambodianCanadianCape VerdeanCarpatho RusynCelticCentral AmericanCentral American IndianCherokeeCheyenneChickasawChileanChineseChippewaChoctawColombianColvilleComancheCosta RicanCreeCreekCroatianCrowCubanCypriotCzechCzechoslovakianDanishDelawareDominicanDutchDutch West IndianEastern EuropeanEcuadorianEgyptianEnglishEstonianEthiopianEuropeanFijianFilipinoFinnishFrenchFrench American IndianFrench CanadianGermanGerman RussianGhanaianGreekGuamanian/ChamorroGuatemalanGuyaneseHaitianHmongHonduranHopiHoumaHungarianIcelanderIndian (Asian)IndonesianInupiatIranianIraqiIrishIroquoisIsraeliItalianJamaicanJapaneseJordanianKenyanKiowaKoreanLaotianLatvianLebaneseLiberianLithuanianLumbeeLuxembourgerMacedonianMalaysianMalteseMarshalleseMenomineeMexicanMexican American IndianMongolianMoroccanNavajoNepaleseNew ZealanderNicaraguanNigerianNorthern EuropeanNorwegianOkinawanOsageOttawaPaiutePakistaniPalestinianPanamanianParaguayanPennsylvania GermanPeruvianPimaPolishPortuguesePotawatomiPuebloPuerto RicanPuget Sound SalishRomanianRussianSalvadoranSamoanScandinavianScotch-IrishScottishSeminoleSenegaleseSerbianShoshoneSierra LeoneanSiouxSlavicSlovakSloveneSomaliSouth AfricanSouth AmericanSouth American IndianSoviet UnionSpaniardSpanishSpanish AmericanSpanish American IndianSri LankanSubsaharan AfricanSudaneseSwedishSwissSyrianTaiwaneseThaiTlingit-HaidaTohono O'OdhamTonganTrinidadian and TobagonianTsimshianTurkishU.S. Virgin IslanderUgandanUkrainianUruguayanUteVenezuelanVietnameseWelshWest IndianYakamaYaquiYugoslavianYumanYup'ikZimbabwean
Immigration
NonimmigrantsImmigrantsAfghanistanAfricaAlbaniaArgentinaArmeniaAsiaAustraliaAustriaBahamasBangladeshBarbadosBelarusBelgiumBelizeBoliviaBosnia and HerzegovinaBrazilBulgariaBurma/MyanmarCabo VerdeCambodiaCameroonCanadaCaribbeanCentral AmericaChileChinaColombiaCongoCosta RicaCroatiaCubaCzechoslovakiaDenmarkDominicaDominican RepublicEastern AfricaEastern AsiaEastern EuropeEcuadorEgyptEl SalvadorEnglandEritreaEthiopiaEuropeFijiFranceGermanyGhanaGreeceGrenadaGuatemalaGuyanaHaitiHondurasHong KongHungaryIndiaIndonesiaIranIraqIrelandIsraelItalyJamaicaJapanJordanKazakhstanKenyaKoreaKuwaitLaosLatin AmericaLatviaLebanonLiberiaLithuaniaMalaysiaMexicoMicronesiaMiddle AfricaMoldovaMoroccoNepalNetherlandsNicaraguaNigeriaNorth AmericaNorth MacedoniaNorthern AfricaNorthern EuropeNorwayOceaniaPakistanPanamaPeruPhilippinesPolandPortugalRomaniaRussiaSaudi ArabiaScotlandSenegalSerbiaSierra LeoneSingaporeSomaliaSouth AfricaSouth AmericaSouth Central AsiaSouth Eastern AsiaSouthern EuropeSpainSri LankaSt. Vincent and the GrenadinesSudanSwedenSwitzerlandSyriaTaiwanThailandTrinidad and TobagoTurkeyUgandaUkraineUruguayUzbekistanVenezuelaVietnamWest IndiesWestern AfricaWestern AsiaWestern EuropeYemenZaireZimbabweAzores
Householder Income Over 65 years
Income
Poverty
Unemployment
Labor Participation
Family Structure
Vehicle Availability
Education Level
Disability

Householder Income Over 65 years Comparison

Native Hawaiians

Immigrants from Yemen

Exceptional
Tragic
$71,021
HOUSEHOLDER INCOME OVER 65 YEARS
100.0/ 100
METRIC RATING
15th/ 347
METRIC RANK
$47,527
HOUSEHOLDER INCOME OVER 65 YEARS
0.0/ 100
METRIC RATING
340th/ 347
METRIC RANK

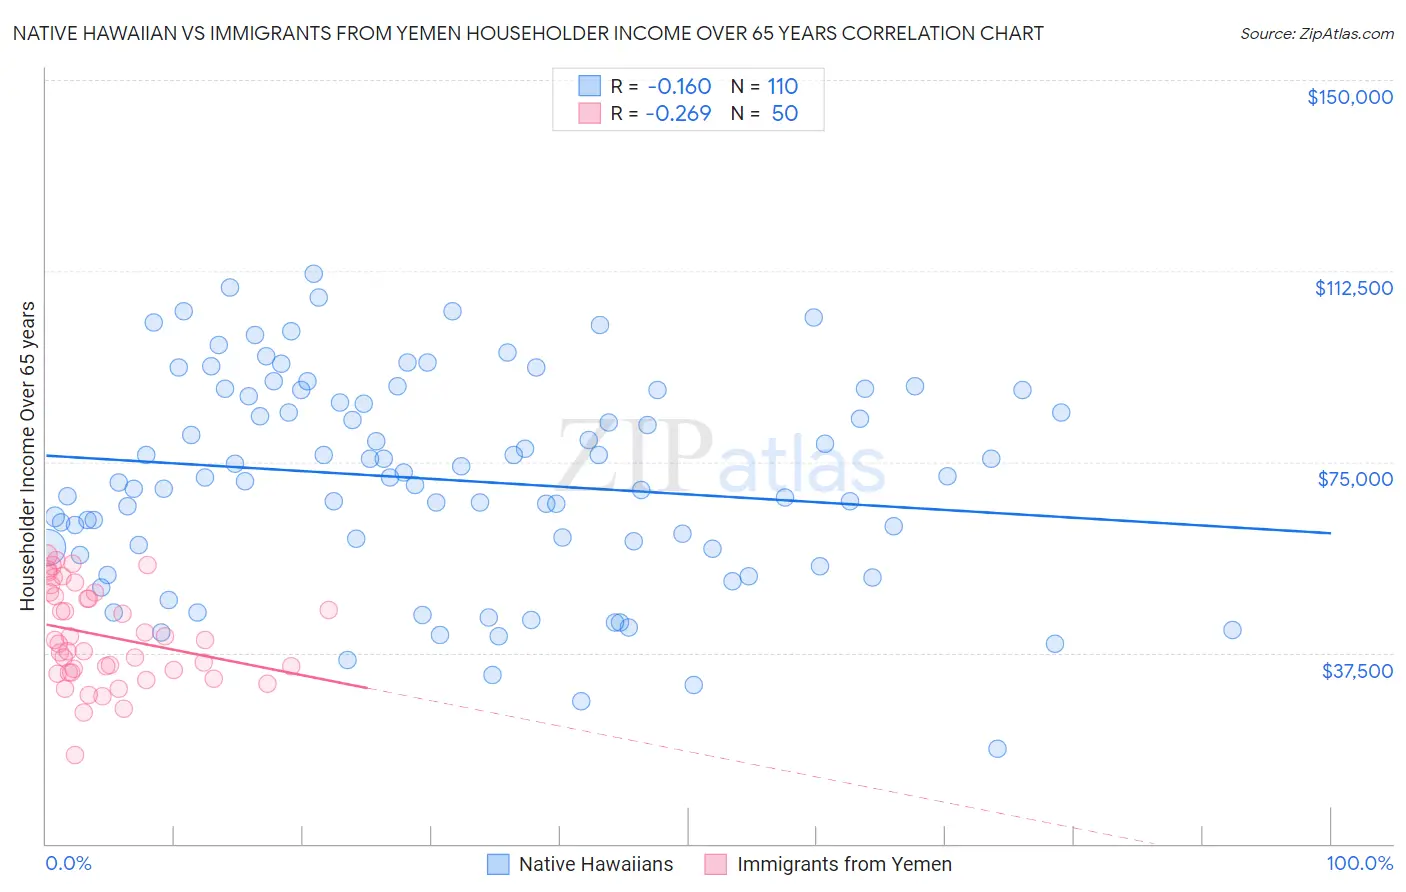
Native Hawaiian vs Immigrants from Yemen Householder Income Over 65 years Correlation Chart

The statistical analysis conducted on geographies consisting of 330,764,253 people shows a poor negative correlation between the proportion of Native Hawaiians and household income with householder over the age of 65 in the United States with a correlation coefficient (R) of -0.160 and weighted average of $71,021. Similarly, the statistical analysis conducted on geographies consisting of 82,406,704 people shows a weak negative correlation between the proportion of Immigrants from Yemen and household income with householder over the age of 65 in the United States with a correlation coefficient (R) of -0.269 and weighted average of $47,527, a difference of 49.4%.
Native Hawaiian vs Immigrants from Yemen Householder Income Over 65 years

Householder Income Over 65 years Correlation Summary

MeasurementNative HawaiianImmigrants from Yemen
Minimum$18,720$17,404
Maximum$112,011$56,646
Range$93,291$39,242
Mean$71,470$40,803
Median$71,949$39,631
Interquartile 25% (IQ1)$58,178$33,662
Interquartile 75% (IQ3)$88,994$49,266
Interquartile Range (IQR)$30,816$15,604
Standard Deviation (Sample)$20,453$9,491
Standard Deviation (Population)$20,359$9,395

Similar Demographics by Householder Income Over 65 years

Demographics Similar to Native Hawaiians by Householder Income Over 65 years

In terms of householder income over 65 years, the demographic groups most similar to Native Hawaiians are Burmese ($71,139, a difference of 0.17%), Okinawan ($70,846, a difference of 0.25%), Immigrants from Korea ($70,696, a difference of 0.46%), Immigrants from Hong Kong ($71,567, a difference of 0.77%), and Eastern European ($70,470, a difference of 0.78%).
DemographicsRating | RankHouseholder Income Over 65 years
Immigrants | Singapore
100.0
/100
|
#8
Exceptional
$72,963
Immigrants | India
100.0
/100
|
#9
Exceptional
$72,804
Bhutanese
100.0
/100
|
#10
Exceptional
$72,288
Thais
100.0
/100
|
#11
Exceptional
$72,099
Cypriots
100.0
/100
|
#12
Exceptional
$71,714
Immigrants | Hong Kong
100.0
/100
|
#13
Exceptional
$71,567
Burmese
100.0
/100
|
#14
Exceptional
$71,139
Native Hawaiians
100.0
/100
|
#15
Exceptional
$71,021
Okinawans
100.0
/100
|
#16
Exceptional
$70,846
Immigrants | Korea
100.0
/100
|
#17
Exceptional
$70,696
Eastern Europeans
100.0
/100
|
#18
Exceptional
$70,470
Indians (Asian)
100.0
/100
|
#19
Exceptional
$70,238
Immigrants | South Central Asia
100.0
/100
|
#20
Exceptional
$70,103
Immigrants | Eastern Asia
100.0
/100
|
#21
Exceptional
$69,872
Immigrants | Israel
100.0
/100
|
#22
Exceptional
$69,857

Demographics Similar to Immigrants from Yemen by Householder Income Over 65 years

In terms of householder income over 65 years, the demographic groups most similar to Immigrants from Yemen are Navajo ($47,722, a difference of 0.41%), Dominican ($46,964, a difference of 1.2%), Immigrants from Cabo Verde ($46,654, a difference of 1.9%), Immigrants from Caribbean ($48,535, a difference of 2.1%), and Tohono O'odham ($49,121, a difference of 3.4%).
DemographicsRating | RankHouseholder Income Over 65 years
Cape Verdeans
0.0
/100
|
#333
Tragic
$50,077
Immigrants | Dominica
0.0
/100
|
#334
Tragic
$50,071
Crow
0.0
/100
|
#335
Tragic
$49,234
Cubans
0.0
/100
|
#336
Tragic
$49,152
Tohono O'odham
0.0
/100
|
#337
Tragic
$49,121
Immigrants | Caribbean
0.0
/100
|
#338
Tragic
$48,535
Navajo
0.0
/100
|
#339
Tragic
$47,722
Immigrants | Yemen
0.0
/100
|
#340
Tragic
$47,527
Dominicans
0.0
/100
|
#341
Tragic
$46,964
Immigrants | Cabo Verde
0.0
/100
|
#342
Tragic
$46,654
Immigrants | Dominican Republic
0.0
/100
|
#343
Tragic
$45,758
Houma
0.0
/100
|
#344
Tragic
$44,822
Immigrants | Cuba
0.0
/100
|
#345
Tragic
$44,735
Puerto Ricans
0.0
/100
|
#346
Tragic
$42,550
Lumbee
0.0
/100
|
#347
Tragic
$40,550