Moroccan vs Immigrants from Venezuela Householder Income Under 25 years
COMPARE
Moroccan
Immigrants from Venezuela
Householder Income Under 25 years
Householder Income Under 25 years Comparison
Moroccans
Immigrants from Venezuela
$53,256
HOUSEHOLDER INCOME UNDER 25 YEARS
93.1/ 100
METRIC RATING
132nd/ 347
METRIC RANK
$50,109
HOUSEHOLDER INCOME UNDER 25 YEARS
0.6/ 100
METRIC RATING
266th/ 347
METRIC RANK
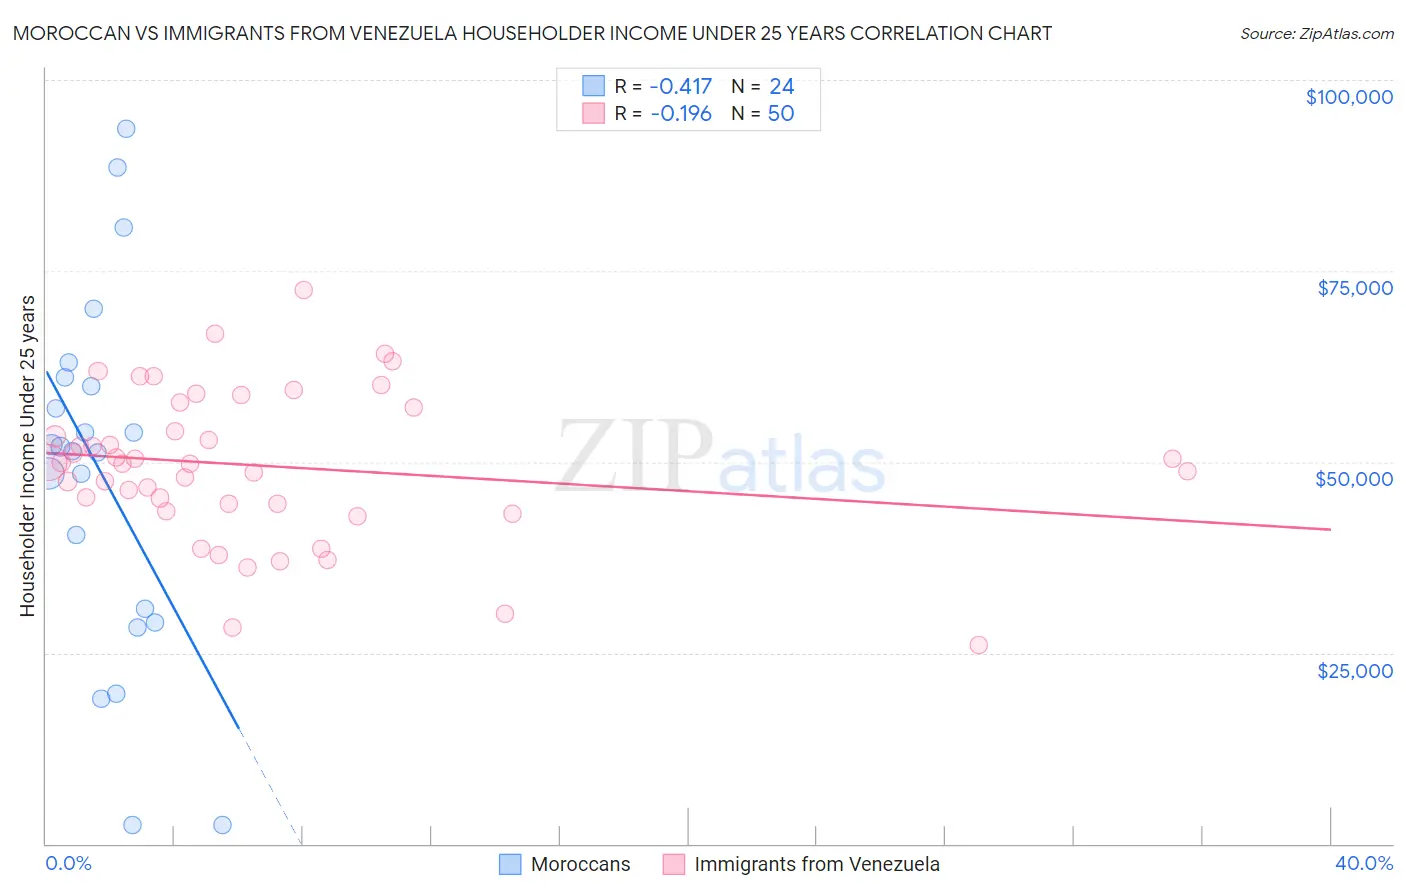
Moroccan vs Immigrants from Venezuela Householder Income Under 25 years Correlation Chart
The statistical analysis conducted on geographies consisting of 180,752,865 people shows a moderate negative correlation between the proportion of Moroccans and household income with householder under the age of 25 in the United States with a correlation coefficient (R) of -0.417 and weighted average of $53,256. Similarly, the statistical analysis conducted on geographies consisting of 252,886,883 people shows a poor negative correlation between the proportion of Immigrants from Venezuela and household income with householder under the age of 25 in the United States with a correlation coefficient (R) of -0.196 and weighted average of $50,109, a difference of 6.3%.
Householder Income Under 25 years Correlation Summary
| Measurement | Moroccan | Immigrants from Venezuela |
| Minimum | $2,499 | $26,011 |
| Maximum | $93,569 | $72,500 |
| Range | $91,070 | $46,489 |
| Mean | $48,217 | $49,474 |
| Median | $51,677 | $49,840 |
| Interquartile 25% (IQ1) | $29,861 | $44,436 |
| Interquartile 75% (IQ3) | $60,431 | $57,134 |
| Interquartile Range (IQR) | $30,570 | $12,698 |
| Standard Deviation (Sample) | $23,674 | $9,803 |
| Standard Deviation (Population) | $23,176 | $9,705 |
Similar Demographics by Householder Income Under 25 years
Demographics Similar to Moroccans by Householder Income Under 25 years
In terms of householder income under 25 years, the demographic groups most similar to Moroccans are Immigrants from Nicaragua ($53,266, a difference of 0.020%), Nicaraguan ($53,275, a difference of 0.030%), New Zealander ($53,294, a difference of 0.070%), Immigrants from Bulgaria ($53,305, a difference of 0.090%), and Immigrants from North America ($53,307, a difference of 0.10%).
| Demographics | Rating | Rank | Householder Income Under 25 years |
| Pakistanis | 94.1 /100 | #125 | Exceptional $53,325 |
| Immigrants | Serbia | 94.1 /100 | #126 | Exceptional $53,321 |
| Immigrants | North America | 93.9 /100 | #127 | Exceptional $53,307 |
| Immigrants | Bulgaria | 93.9 /100 | #128 | Exceptional $53,305 |
| New Zealanders | 93.7 /100 | #129 | Exceptional $53,294 |
| Nicaraguans | 93.4 /100 | #130 | Exceptional $53,275 |
| Immigrants | Nicaragua | 93.3 /100 | #131 | Exceptional $53,266 |
| Moroccans | 93.1 /100 | #132 | Exceptional $53,256 |
| Immigrants | Immigrants | 92.2 /100 | #133 | Exceptional $53,201 |
| Immigrants | Northern Africa | 91.9 /100 | #134 | Exceptional $53,185 |
| Chileans | 91.9 /100 | #135 | Exceptional $53,185 |
| Armenians | 91.8 /100 | #136 | Exceptional $53,179 |
| Immigrants | Barbados | 91.5 /100 | #137 | Exceptional $53,163 |
| Norwegians | 90.8 /100 | #138 | Exceptional $53,127 |
| Costa Ricans | 90.4 /100 | #139 | Exceptional $53,106 |
Demographics Similar to Immigrants from Venezuela by Householder Income Under 25 years
In terms of householder income under 25 years, the demographic groups most similar to Immigrants from Venezuela are Belgian ($50,113, a difference of 0.010%), Fijian ($50,132, a difference of 0.050%), Immigrants from Laos ($50,041, a difference of 0.14%), Immigrants from Dominican Republic ($50,204, a difference of 0.19%), and Venezuelan ($50,011, a difference of 0.19%).
| Demographics | Rating | Rank | Householder Income Under 25 years |
| Immigrants | Dominica | 1.0 /100 | #259 | Tragic $50,301 |
| Hispanics or Latinos | 0.9 /100 | #260 | Tragic $50,279 |
| Hungarians | 0.9 /100 | #261 | Tragic $50,247 |
| Haitians | 0.8 /100 | #262 | Tragic $50,231 |
| Immigrants | Dominican Republic | 0.8 /100 | #263 | Tragic $50,204 |
| Fijians | 0.6 /100 | #264 | Tragic $50,132 |
| Belgians | 0.6 /100 | #265 | Tragic $50,113 |
| Immigrants | Venezuela | 0.6 /100 | #266 | Tragic $50,109 |
| Immigrants | Laos | 0.5 /100 | #267 | Tragic $50,041 |
| Venezuelans | 0.5 /100 | #268 | Tragic $50,011 |
| Ute | 0.5 /100 | #269 | Tragic $49,997 |
| Mexicans | 0.5 /100 | #270 | Tragic $49,989 |
| Taiwanese | 0.3 /100 | #271 | Tragic $49,804 |
| Colville | 0.3 /100 | #272 | Tragic $49,774 |
| Slovaks | 0.3 /100 | #273 | Tragic $49,753 |