Moroccan vs French Median Family Income
COMPARE
Moroccan
French
Median Family Income
Median Family Income Comparison
Moroccans
French
$104,488
MEDIAN FAMILY INCOME
71.6/ 100
METRIC RATING
157th/ 347
METRIC RANK
$102,368
MEDIAN FAMILY INCOME
46.1/ 100
METRIC RATING
176th/ 347
METRIC RANK
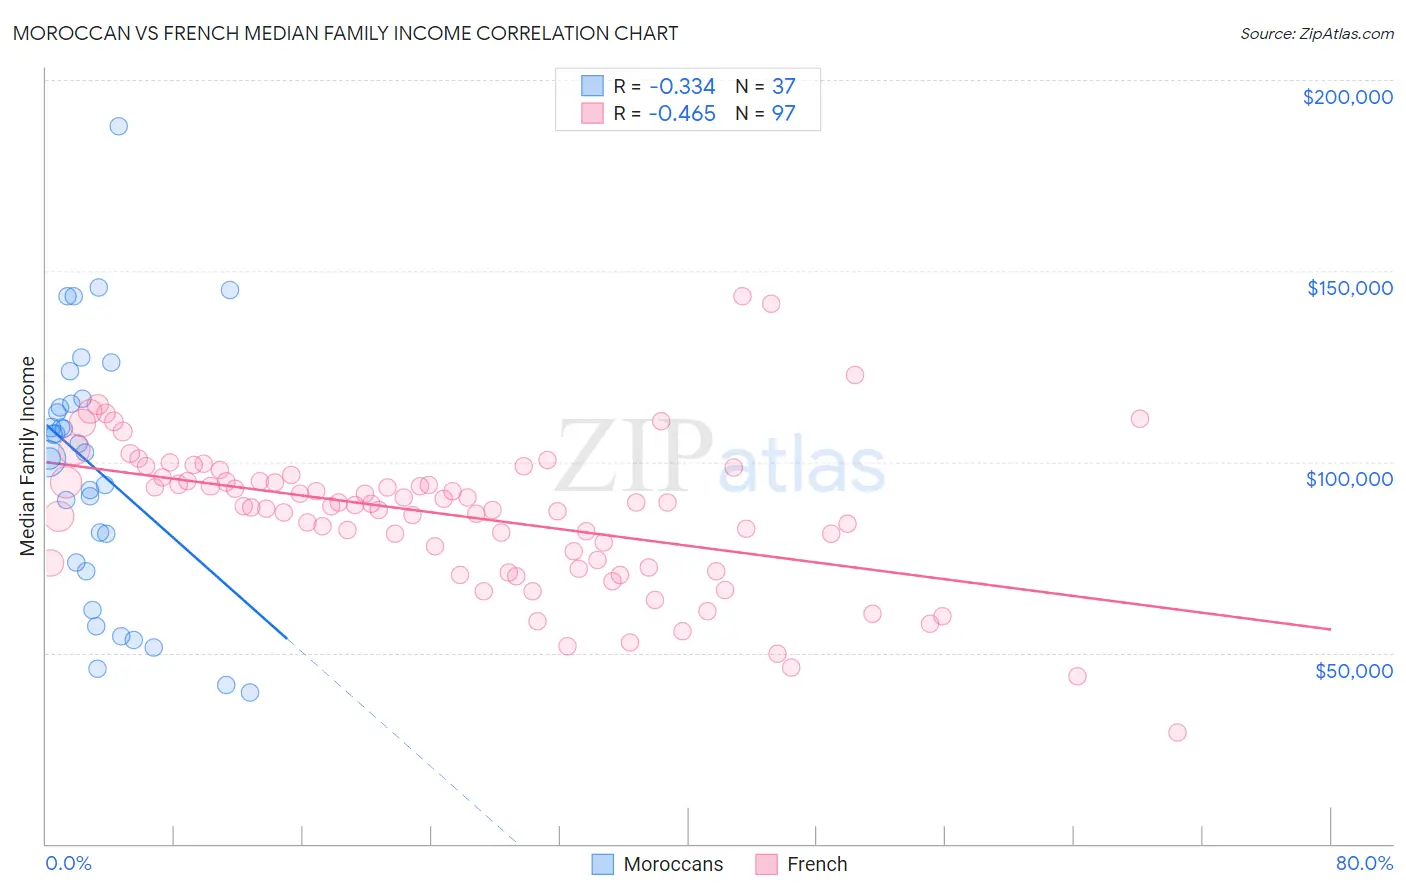
Moroccan vs French Median Family Income Correlation Chart
The statistical analysis conducted on geographies consisting of 201,715,101 people shows a mild negative correlation between the proportion of Moroccans and median family income in the United States with a correlation coefficient (R) of -0.334 and weighted average of $104,488. Similarly, the statistical analysis conducted on geographies consisting of 571,052,079 people shows a moderate negative correlation between the proportion of French and median family income in the United States with a correlation coefficient (R) of -0.465 and weighted average of $102,368, a difference of 2.1%.
Median Family Income Correlation Summary
| Measurement | Moroccan | French |
| Minimum | $39,712 | $29,018 |
| Maximum | $187,788 | $143,457 |
| Range | $148,076 | $114,439 |
| Mean | $98,112 | $85,989 |
| Median | $102,324 | $88,473 |
| Interquartile 25% (IQ1) | $72,461 | $72,966 |
| Interquartile 75% (IQ3) | $115,754 | $95,475 |
| Interquartile Range (IQR) | $43,293 | $22,509 |
| Standard Deviation (Sample) | $33,816 | $19,163 |
| Standard Deviation (Population) | $33,356 | $19,064 |
Demographics Similar to Moroccans and French by Median Family Income
In terms of median family income, the demographic groups most similar to Moroccans are Scandinavian ($104,410, a difference of 0.080%), Swiss ($104,396, a difference of 0.090%), Scottish ($104,288, a difference of 0.19%), Icelander ($104,282, a difference of 0.20%), and Basque ($104,760, a difference of 0.26%). Similarly, the demographic groups most similar to French are Immigrants from Eastern Africa ($102,451, a difference of 0.080%), Finnish ($102,676, a difference of 0.30%), Belgian ($102,788, a difference of 0.41%), Immigrants from Eritrea ($102,823, a difference of 0.44%), and Alsatian ($103,010, a difference of 0.63%).
| Demographics | Rating | Rank | Median Family Income |
| Basques | 74.4 /100 | #156 | Good $104,760 |
| Moroccans | 71.6 /100 | #157 | Good $104,488 |
| Scandinavians | 70.8 /100 | #158 | Good $104,410 |
| Swiss | 70.7 /100 | #159 | Good $104,396 |
| Scottish | 69.5 /100 | #160 | Good $104,288 |
| Icelanders | 69.4 /100 | #161 | Good $104,282 |
| Immigrants | Sierra Leone | 66.2 /100 | #162 | Good $103,990 |
| Costa Ricans | 66.2 /100 | #163 | Good $103,989 |
| Sierra Leoneans | 64.7 /100 | #164 | Good $103,859 |
| Slovaks | 63.1 /100 | #165 | Good $103,729 |
| English | 62.6 /100 | #166 | Good $103,684 |
| South American Indians | 61.9 /100 | #167 | Good $103,624 |
| Immigrants | Peru | 60.8 /100 | #168 | Good $103,534 |
| Czechoslovakians | 57.6 /100 | #169 | Average $103,273 |
| Immigrants | Uzbekistan | 56.6 /100 | #170 | Average $103,197 |
| Alsatians | 54.3 /100 | #171 | Average $103,010 |
| Immigrants | Eritrea | 51.9 /100 | #172 | Average $102,823 |
| Belgians | 51.4 /100 | #173 | Average $102,788 |
| Finns | 50.0 /100 | #174 | Average $102,676 |
| Immigrants | Eastern Africa | 47.1 /100 | #175 | Average $102,451 |
| French | 46.1 /100 | #176 | Average $102,368 |