Marshallese vs Immigrants from Germany Median Male Earnings
COMPARE
Marshallese
Immigrants from Germany
Median Male Earnings
Median Male Earnings Comparison
Marshallese
Immigrants from Germany
$48,137
MEDIAN MALE EARNINGS
0.2/ 100
METRIC RATING
281st/ 347
METRIC RANK
$56,542
MEDIAN MALE EARNINGS
88.2/ 100
METRIC RATING
133rd/ 347
METRIC RANK
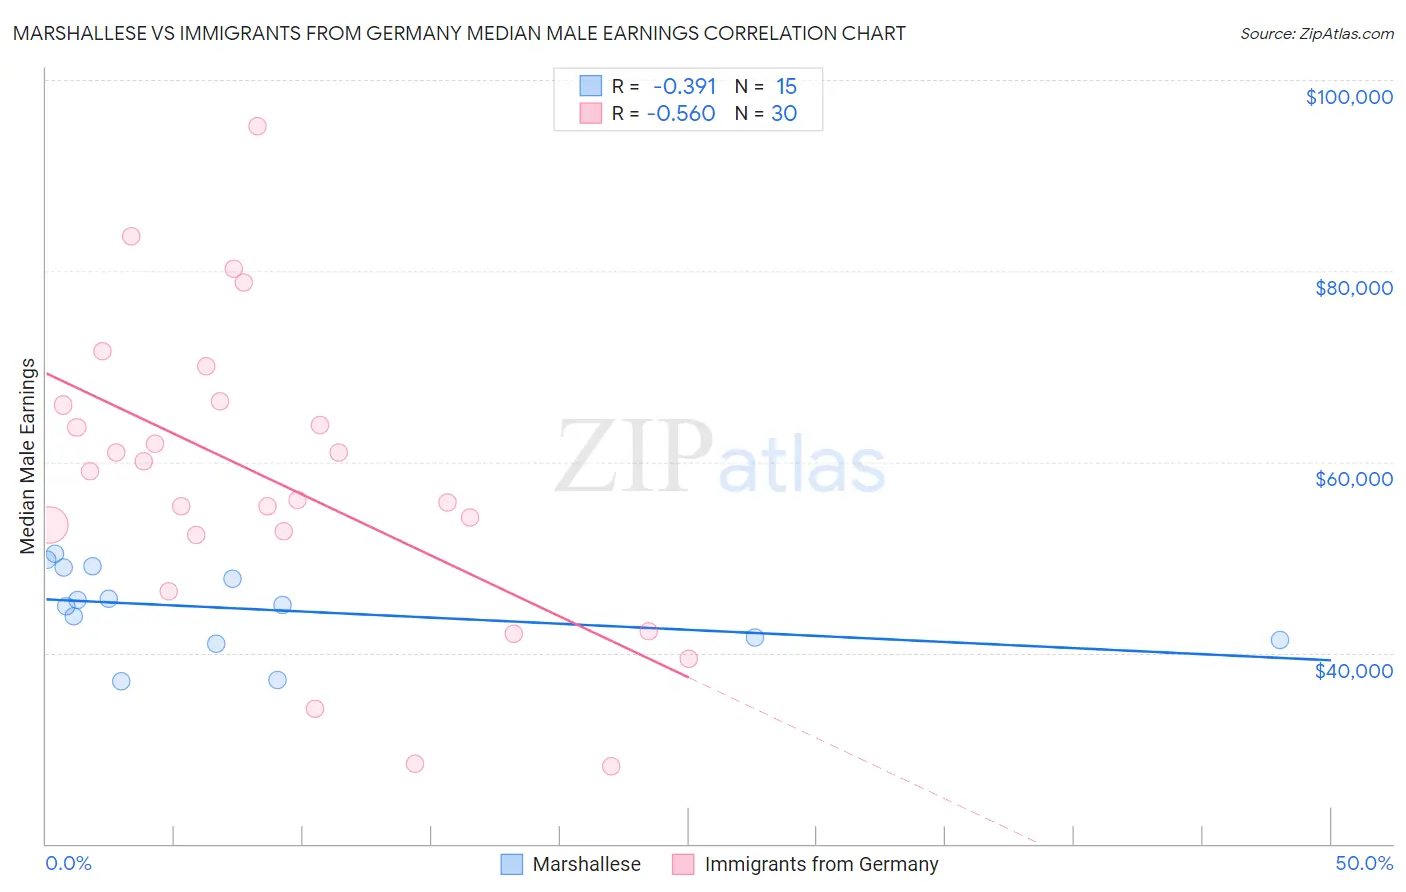
Marshallese vs Immigrants from Germany Median Male Earnings Correlation Chart
The statistical analysis conducted on geographies consisting of 14,760,790 people shows a mild negative correlation between the proportion of Marshallese and median male earnings in the United States with a correlation coefficient (R) of -0.391 and weighted average of $48,137. Similarly, the statistical analysis conducted on geographies consisting of 463,604,477 people shows a substantial negative correlation between the proportion of Immigrants from Germany and median male earnings in the United States with a correlation coefficient (R) of -0.560 and weighted average of $56,542, a difference of 17.5%.
Median Male Earnings Correlation Summary
| Measurement | Marshallese | Immigrants from Germany |
| Minimum | $37,012 | $28,125 |
| Maximum | $50,395 | $95,140 |
| Range | $13,383 | $67,015 |
| Mean | $44,583 | $57,924 |
| Median | $45,000 | $57,493 |
| Interquartile 25% (IQ1) | $41,333 | $52,399 |
| Interquartile 75% (IQ3) | $48,969 | $65,976 |
| Interquartile Range (IQR) | $7,636 | $13,576 |
| Standard Deviation (Sample) | $4,286 | $15,513 |
| Standard Deviation (Population) | $4,141 | $15,253 |
Similar Demographics by Median Male Earnings
Demographics Similar to Marshallese by Median Male Earnings
In terms of median male earnings, the demographic groups most similar to Marshallese are Central American ($48,093, a difference of 0.090%), Comanche ($48,202, a difference of 0.13%), Immigrants from Jamaica ($48,040, a difference of 0.20%), Hmong ($48,254, a difference of 0.24%), and African ($47,994, a difference of 0.30%).
| Demographics | Rating | Rank | Median Male Earnings |
| Colville | 0.3 /100 | #274 | Tragic $48,516 |
| Immigrants | Somalia | 0.3 /100 | #275 | Tragic $48,439 |
| Blackfeet | 0.3 /100 | #276 | Tragic $48,402 |
| Belizeans | 0.2 /100 | #277 | Tragic $48,358 |
| Immigrants | Liberia | 0.2 /100 | #278 | Tragic $48,317 |
| Hmong | 0.2 /100 | #279 | Tragic $48,254 |
| Comanche | 0.2 /100 | #280 | Tragic $48,202 |
| Marshallese | 0.2 /100 | #281 | Tragic $48,137 |
| Central Americans | 0.2 /100 | #282 | Tragic $48,093 |
| Immigrants | Jamaica | 0.2 /100 | #283 | Tragic $48,040 |
| Africans | 0.2 /100 | #284 | Tragic $47,994 |
| Paiute | 0.2 /100 | #285 | Tragic $47,991 |
| Mexican American Indians | 0.2 /100 | #286 | Tragic $47,990 |
| Immigrants | El Salvador | 0.2 /100 | #287 | Tragic $47,973 |
| Shoshone | 0.2 /100 | #288 | Tragic $47,930 |
Demographics Similar to Immigrants from Germany by Median Male Earnings
In terms of median male earnings, the demographic groups most similar to Immigrants from Germany are Czech ($56,546, a difference of 0.010%), Moroccan ($56,499, a difference of 0.080%), Irish ($56,464, a difference of 0.14%), Immigrants from Saudi Arabia ($56,452, a difference of 0.16%), and Portuguese ($56,663, a difference of 0.21%).
| Demographics | Rating | Rank | Median Male Earnings |
| Chinese | 91.1 /100 | #126 | Exceptional $56,872 |
| Brazilians | 90.9 /100 | #127 | Exceptional $56,837 |
| Immigrants | Syria | 90.8 /100 | #128 | Exceptional $56,830 |
| Pakistanis | 89.9 /100 | #129 | Excellent $56,719 |
| Koreans | 89.4 /100 | #130 | Excellent $56,672 |
| Portuguese | 89.4 /100 | #131 | Excellent $56,663 |
| Czechs | 88.2 /100 | #132 | Excellent $56,546 |
| Immigrants | Germany | 88.2 /100 | #133 | Excellent $56,542 |
| Moroccans | 87.7 /100 | #134 | Excellent $56,499 |
| Irish | 87.4 /100 | #135 | Excellent $56,464 |
| Immigrants | Saudi Arabia | 87.2 /100 | #136 | Excellent $56,452 |
| Slavs | 86.5 /100 | #137 | Excellent $56,390 |
| Slovaks | 85.5 /100 | #138 | Excellent $56,306 |
| Zimbabweans | 85.5 /100 | #139 | Excellent $56,302 |
| Luxembourgers | 85.5 /100 | #140 | Excellent $56,300 |