Marshallese vs Immigrants from Belarus Median Female Earnings
COMPARE
Marshallese
Immigrants from Belarus
Median Female Earnings
Median Female Earnings Comparison
Marshallese
Immigrants from Belarus
$36,459
MEDIAN FEMALE EARNINGS
0.1/ 100
METRIC RATING
277th/ 347
METRIC RANK
$44,757
MEDIAN FEMALE EARNINGS
100.0/ 100
METRIC RATING
26th/ 347
METRIC RANK
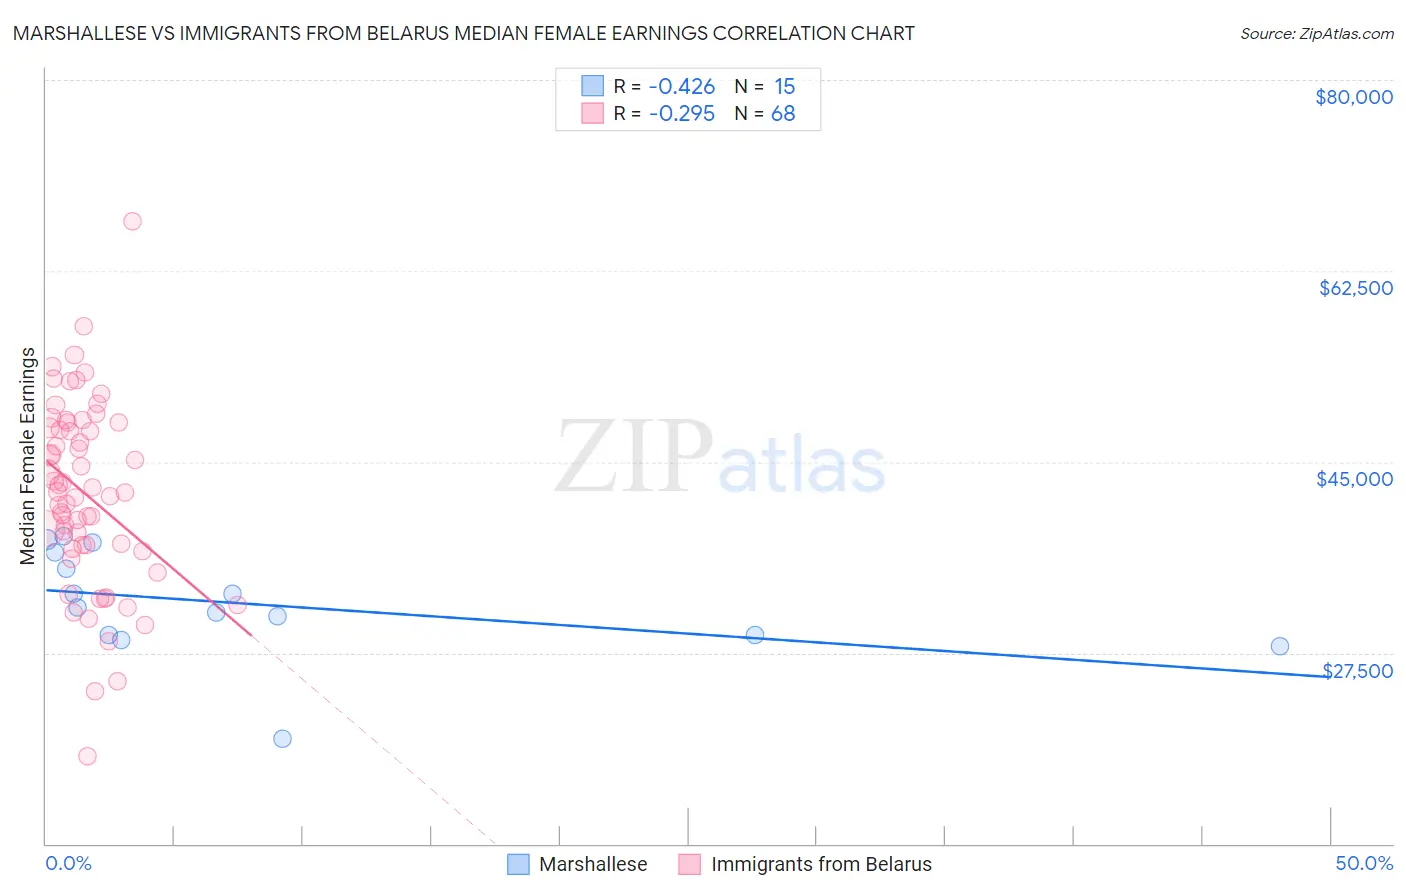
Marshallese vs Immigrants from Belarus Median Female Earnings Correlation Chart
The statistical analysis conducted on geographies consisting of 14,760,991 people shows a moderate negative correlation between the proportion of Marshallese and median female earnings in the United States with a correlation coefficient (R) of -0.426 and weighted average of $36,459. Similarly, the statistical analysis conducted on geographies consisting of 150,178,879 people shows a weak negative correlation between the proportion of Immigrants from Belarus and median female earnings in the United States with a correlation coefficient (R) of -0.295 and weighted average of $44,757, a difference of 22.8%.
Median Female Earnings Correlation Summary
| Measurement | Marshallese | Immigrants from Belarus |
| Minimum | $19,583 | $17,969 |
| Maximum | $38,170 | $67,083 |
| Range | $18,587 | $49,114 |
| Mean | $31,981 | $42,072 |
| Median | $31,627 | $42,243 |
| Interquartile 25% (IQ1) | $29,109 | $37,178 |
| Interquartile 75% (IQ3) | $36,675 | $48,362 |
| Interquartile Range (IQR) | $7,566 | $11,183 |
| Standard Deviation (Sample) | $4,908 | $8,617 |
| Standard Deviation (Population) | $4,742 | $8,553 |
Similar Demographics by Median Female Earnings
Demographics Similar to Marshallese by Median Female Earnings
In terms of median female earnings, the demographic groups most similar to Marshallese are Central American ($36,492, a difference of 0.090%), U.S. Virgin Islander ($36,424, a difference of 0.10%), Immigrants from Caribbean ($36,414, a difference of 0.12%), Iroquois ($36,408, a difference of 0.14%), and African ($36,530, a difference of 0.19%).
| Demographics | Rating | Rank | Median Female Earnings |
| French American Indians | 0.3 /100 | #270 | Tragic $36,920 |
| Nicaraguans | 0.3 /100 | #271 | Tragic $36,904 |
| Immigrants | Dominican Republic | 0.3 /100 | #272 | Tragic $36,857 |
| Immigrants | Laos | 0.3 /100 | #273 | Tragic $36,841 |
| Immigrants | El Salvador | 0.2 /100 | #274 | Tragic $36,673 |
| Africans | 0.1 /100 | #275 | Tragic $36,530 |
| Central Americans | 0.1 /100 | #276 | Tragic $36,492 |
| Marshallese | 0.1 /100 | #277 | Tragic $36,459 |
| U.S. Virgin Islanders | 0.1 /100 | #278 | Tragic $36,424 |
| Immigrants | Caribbean | 0.1 /100 | #279 | Tragic $36,414 |
| Iroquois | 0.1 /100 | #280 | Tragic $36,408 |
| Spanish Americans | 0.1 /100 | #281 | Tragic $36,391 |
| Haitians | 0.1 /100 | #282 | Tragic $36,374 |
| Immigrants | Haiti | 0.1 /100 | #283 | Tragic $36,203 |
| Indonesians | 0.1 /100 | #284 | Tragic $36,140 |
Demographics Similar to Immigrants from Belarus by Median Female Earnings
In terms of median female earnings, the demographic groups most similar to Immigrants from Belarus are Immigrants from Sweden ($44,774, a difference of 0.040%), Turkish ($44,695, a difference of 0.14%), Immigrants from Russia ($44,680, a difference of 0.17%), Immigrants from Korea ($44,847, a difference of 0.20%), and Burmese ($44,911, a difference of 0.34%).
| Demographics | Rating | Rank | Median Female Earnings |
| Eastern Europeans | 100.0 /100 | #19 | Exceptional $45,385 |
| Immigrants | Japan | 100.0 /100 | #20 | Exceptional $45,323 |
| Cambodians | 100.0 /100 | #21 | Exceptional $45,014 |
| Immigrants | Greece | 100.0 /100 | #22 | Exceptional $44,976 |
| Burmese | 100.0 /100 | #23 | Exceptional $44,911 |
| Immigrants | Korea | 100.0 /100 | #24 | Exceptional $44,847 |
| Immigrants | Sweden | 100.0 /100 | #25 | Exceptional $44,774 |
| Immigrants | Belarus | 100.0 /100 | #26 | Exceptional $44,757 |
| Turks | 100.0 /100 | #27 | Exceptional $44,695 |
| Immigrants | Russia | 100.0 /100 | #28 | Exceptional $44,680 |
| Immigrants | Belgium | 100.0 /100 | #29 | Exceptional $44,587 |
| Asians | 100.0 /100 | #30 | Exceptional $44,586 |
| Immigrants | France | 100.0 /100 | #31 | Exceptional $44,541 |
| Immigrants | Northern Europe | 100.0 /100 | #32 | Exceptional $44,366 |
| Immigrants | Asia | 100.0 /100 | #33 | Exceptional $44,198 |